Starter
For freelancers and small teams.
$ 24 /mo
Billed monthly · cancel anytime
Platforms3
Accounts10
.svg) The Trade Desk query · Power BI format
The Trade Desk query · Power BI format
 The Trade Desk
One source
The Trade Desk
One source
 Saved query
API URL
Power BI
Web · Import
Saved query
API URL
Power BI
Web · Import
Used by the world's leading companies









Available metrics
Available dimensions
The Trade Desk
3 advertising accounts
Connected
 Google Ads
2 advertising accounts
Connected
Google Ads
2 advertising accounts
Connected
 Google Analytics 4
1 web property
Connected
Google Analytics 4
1 web property
Connected
 HubSpot
1 CRM portal
Connected
HubSpot
1 CRM portal
Connected

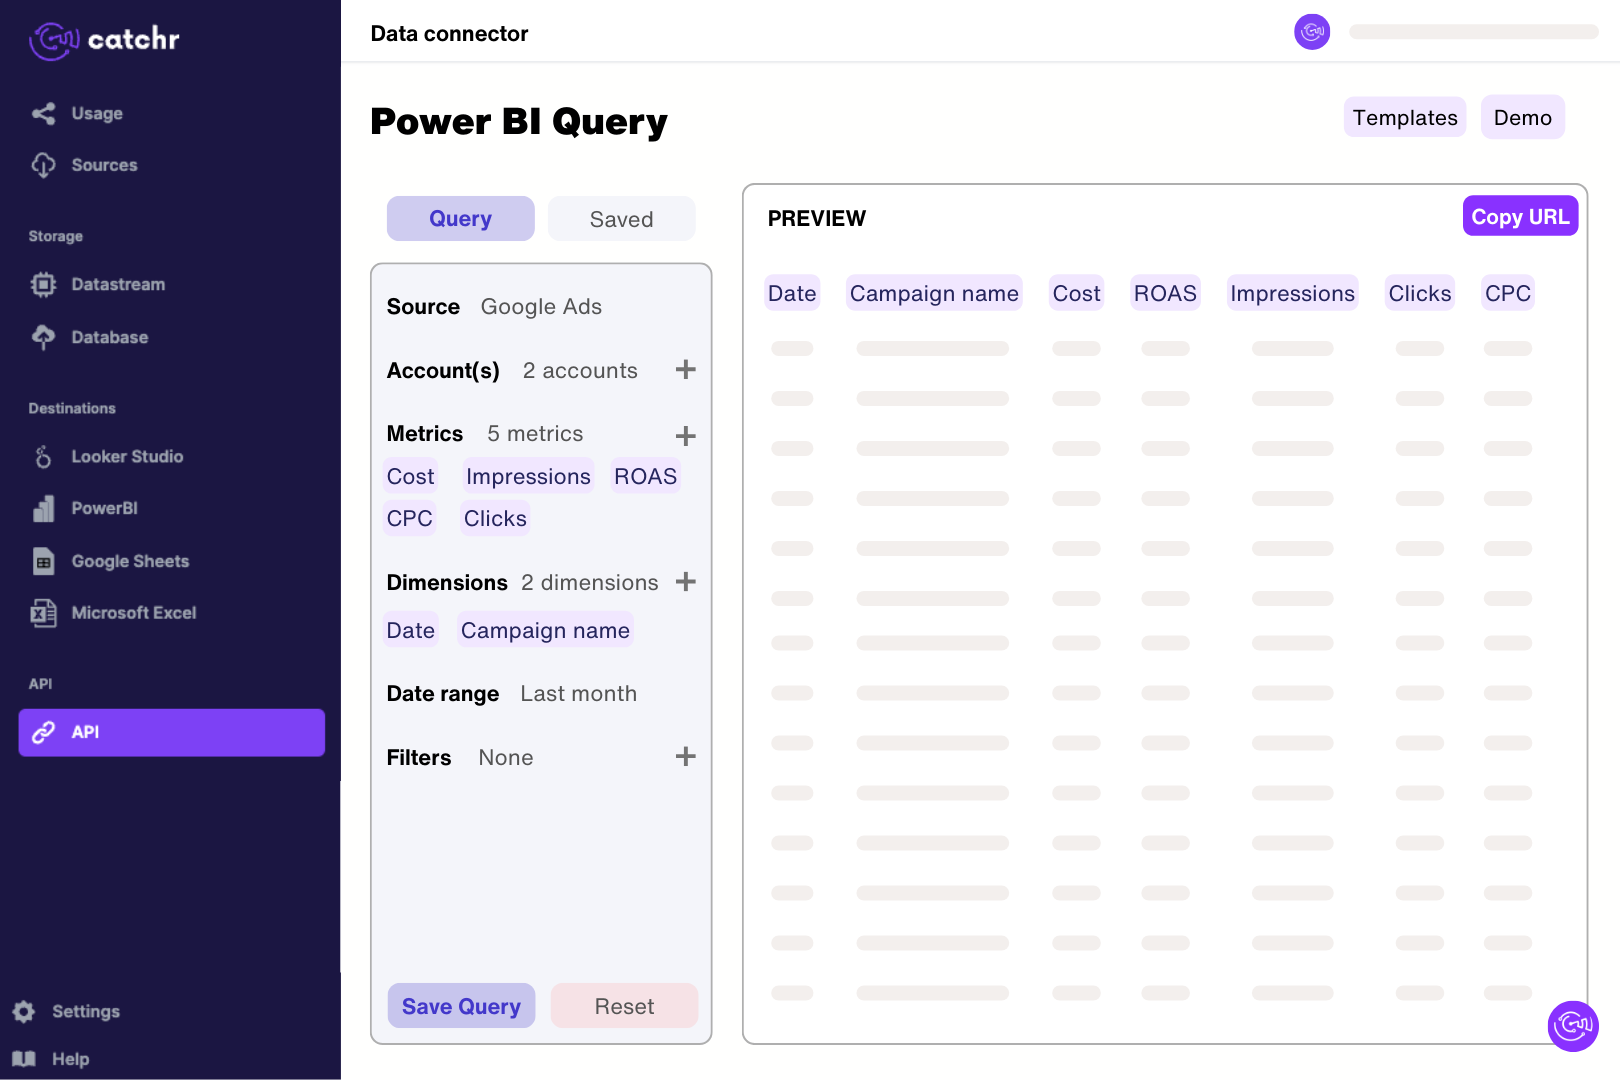
Connect The Trade Desk in Catchr with access to the advertisers you want to report on. In Catchr’s Power BI query builder, select campaign impressions, clicks and spend in advertiser currency and preview a short extraction. Import the generated URL through Get data > Web in Power BI Desktop. Check the returned rows before building measures, keeping advertiser cost versus partner cost and USD variants clear in the model.
Catchr exposes impressions, clicks, spend, CTR, CPM, conversions, CPA, video starts and completions, viewability, and reach fields where available. Advertiser, campaign, and ad-group information provides context. Build separate views for delivery, outcomes, and video engagement rather than assuming every metric applies to every campaign format.
The connector includes advertiser, partner, and TTD cost fields, with advertiser-currency, partner-currency, and USD variants. These fields describe different cost perspectives or currencies and should not be combined into one spend total. Choose the same measure as your platform report, then label it clearly in the dashboard.
Use the conversion event and attribution method that match your reporting objective. Catchr exposes click-conversion, view-through, conversion-touch, and time-weighted-decay families, including numbered conversion fields. Confirm what each configured conversion represents in your account. Adding several attribution measures can count the same business outcome more than once.
Yes, but keep them as separate measures. Video starts, quartile completions, and completed views describe playback, while viewability describes whether the ad met a visibility measurement. Use the platform-provided completion or viewability metric that matches your comparison, and check its denominator before calculating a combined rate across campaigns.
No. Unique-person and unique-household counts can include the same audience on several days or across campaigns. Adding those values can overstate reach for the combined period. Use a reach result calculated for the intended reporting scope where available, and keep impressions separate because they count exposures rather than distinct people.
Yes. Add sources such as Display & Video 360 to compare delivery and spending in one dashboard. Align date ranges, currencies, and cost definitions. Keep attributed conversion totals labeled by platform because cross-platform reporting does not automatically remove overlapping audiences or conversions.
Our team is always here to answer any questions you may have about our data connector.
Connect your marketing platforms and build a data workflow your entire agency can use.





.svg)



























.png)




.svg)