Starter
For freelancers and small teams.
$ 24 /mo
Billed monthly · cancel anytime
Platforms3
Accounts10
.svg) Amazon Vendor Central query · Power BI format
Amazon Vendor Central query · Power BI format
 Amazon Vendor Central
One source
Amazon Vendor Central
One source
 Saved query
API URL
Power BI
Web · Import
Saved query
API URL
Power BI
Web · Import
Used by the world's leading companies









Available metrics
Available dimensions
Amazon Vendor Central
3 advertising accounts
Connected
 Google Ads
2 advertising accounts
Connected
Google Ads
2 advertising accounts
Connected
 Google Analytics 4
1 web property
Connected
Google Analytics 4
1 web property
Connected
 HubSpot
1 CRM portal
Connected
HubSpot
1 CRM portal
Connected

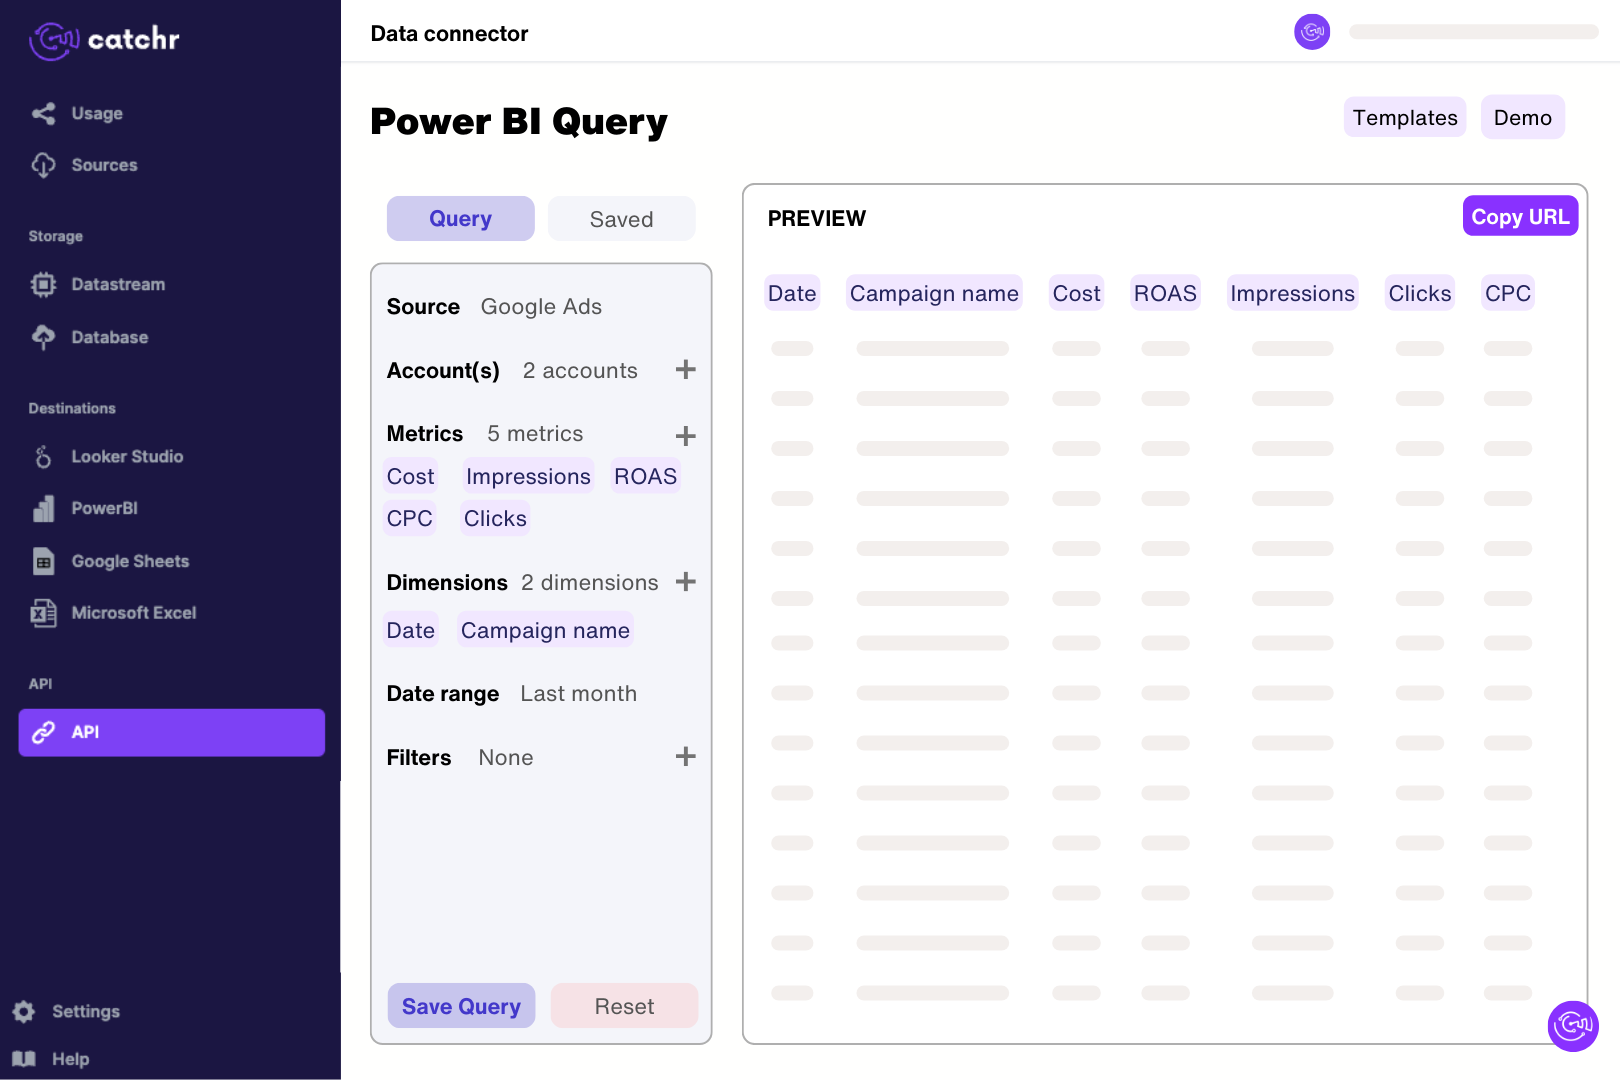
Authorize Vendor Central access in Catchr and select the marketplace, vendor report, distributor view and selling program. In Catchr’s Power BI query builder, select ordered revenue or shipped revenue for one reporting period and preview a short extraction. Import the generated URL through Get data > Web in Power BI Desktop. Check the returned rows before building measures, keeping report level so aggregate and ASIN rows are never summed together clear in the model.
No. This connector retrieves vendor retail analytics reports. Use Amazon Seller for the seller reports supported by that source, and Amazon Ads for advertising performance. You can place them in one dashboard, but a retail sales total should not be labelled as sales attributed to advertising.
Catchr supports Vendor Sales, Vendor Traffic, Vendor Inventory, Vendor Forecasting and Vendor Net Pure Product Margin reports. Available fields include ordered and shipped revenue and units, glance views, sellable inventory, open purchase order units and forecast quantities. Select the report that contains the fields you need; every field is not available in every report.
Check the Report Level field. Catchr can return an aggregate row and ASIN-level rows from the same report. Filter to aggregate for a catalog total, or to asin for product analysis; summing both counts the same underlying activity twice. Also keep ordered revenue and shipped revenue separate and verify the currency before combining marketplaces.
Match the report type, marketplace, reporting period, distributor view and selling program. Manufacturing and sourcing views cover different scopes, so changing the view can change the result. Use the same revenue definition and date boundaries in both tools. For inventory, distinguish a stock balance from units received or shipped: adding stock balances across dates does not measure sales.
Amazon requires date boundaries that match the selected reporting period. Choose dates appropriate to a daily, weekly or monthly report rather than combining an arbitrary range with a different period setting. If report generation fails, check the period, available data and Amazon's error message. Forecasting is a separate case: the connector requests the latest forecast without sending the Catchr query's date range to Amazon.
The forecasting report returns Amazon's latest forecast snapshot, with its forecast generation date and available ASIN forecast quantities. Selecting an older date range does not retrieve a previous forecast version. To compare forecast revisions over time, save dated snapshots separately and compare equivalent forecast periods; do not treat the latest forecast as an archive of earlier predictions.
This connector uses Amazon's standard vendor reports, which must be generated and downloaded before the results can appear. It does not request the separate Rapid Retail Analytics hourly reports. Dashboard refresh and Amazon report availability are different steps, so use the report period and source dates to judge freshness rather than assuming a newly refreshed chart shows live stock.
Our team is always here to answer any questions you may have about our data connector.
Connect your marketing platforms and build a data workflow your entire agency can use.





.svg)



























.png)




.svg)