Home > Destinations > Power BI > Amplitude

Connect Amplitude to Power BI

Connect Amplitude to Power BI and and make the most of your data with direct integration into Power BI. Discover how to transfer, analyze, and visualize your marketing data to support better, data-driven decisions.

Amplitude query · Power BI format
Ready to refresh
Amplitude One source
Saved query API URL
Power BI Web · Import
Amplitude accounts One or several selected accounts
Reporting grain Date · campaign · ad set · ad
Fields Selected metrics + dimensions
Date range Last 28 days · example preset
Filters Optional · query-specific
Power BI mode Import through Web (Basic)
One saved URL represents one Catchr source. Multiple Amplitude accounts can share the query.

Used by the world's leading companies

Get Amplitude data into Power BI

A no-code connection that works in Power BI Desktop and in the Power BI service.

Connect your data

Launch Amplitude reporting faster

Skip ODBC drivers and custom API scripts. The connection runs from your browser and Power BI, with nothing else to install on your machine.

Automate extraction

Always work with fresh numbers

Once the report is published, Power BI calls your Facebook Ads query again on the schedule you choose, so weekly reviews start from current figures.

More than just one source

Connect your entire stack. Not only Amplitude.

Connect not only your Amplitude account but all your Analytics accounts too.

Start with a template

Ready-to-use Power BI dashboards

Move faster with templates built for Analytics reporting in Power BI.

Use your Amplitude data with ready-to-use dashboards for tracking performance, trends, and key indicators.

Amplitude metrics and dimensions available in Power BI

Access 0 metrics and 53 dimensions from Amplitude connectors including , Event Type, Event Time, User Id, Platform, Device Type, Country, Event Properties, User Properties and more.

0

Available metrics

53

Available dimensions

How to connect Amplitude to Power BI ?

Four steps, from Catchr to a refreshed Power BI report.

Step one

Authorize Amplitude

Connect Amplitude in Catchr with a Amplitude user that has access to the Analytics accounts you need, and make those accounts available for reporting.

Client A · Connected sources
5 sources ready
Amplitude 3 advertising accounts Connected
Google Ads 2 advertising accounts Connected
Google Analytics 4 1 web property Connected
HubSpot 1 CRM portal Connected
Step two

Build and preview the query

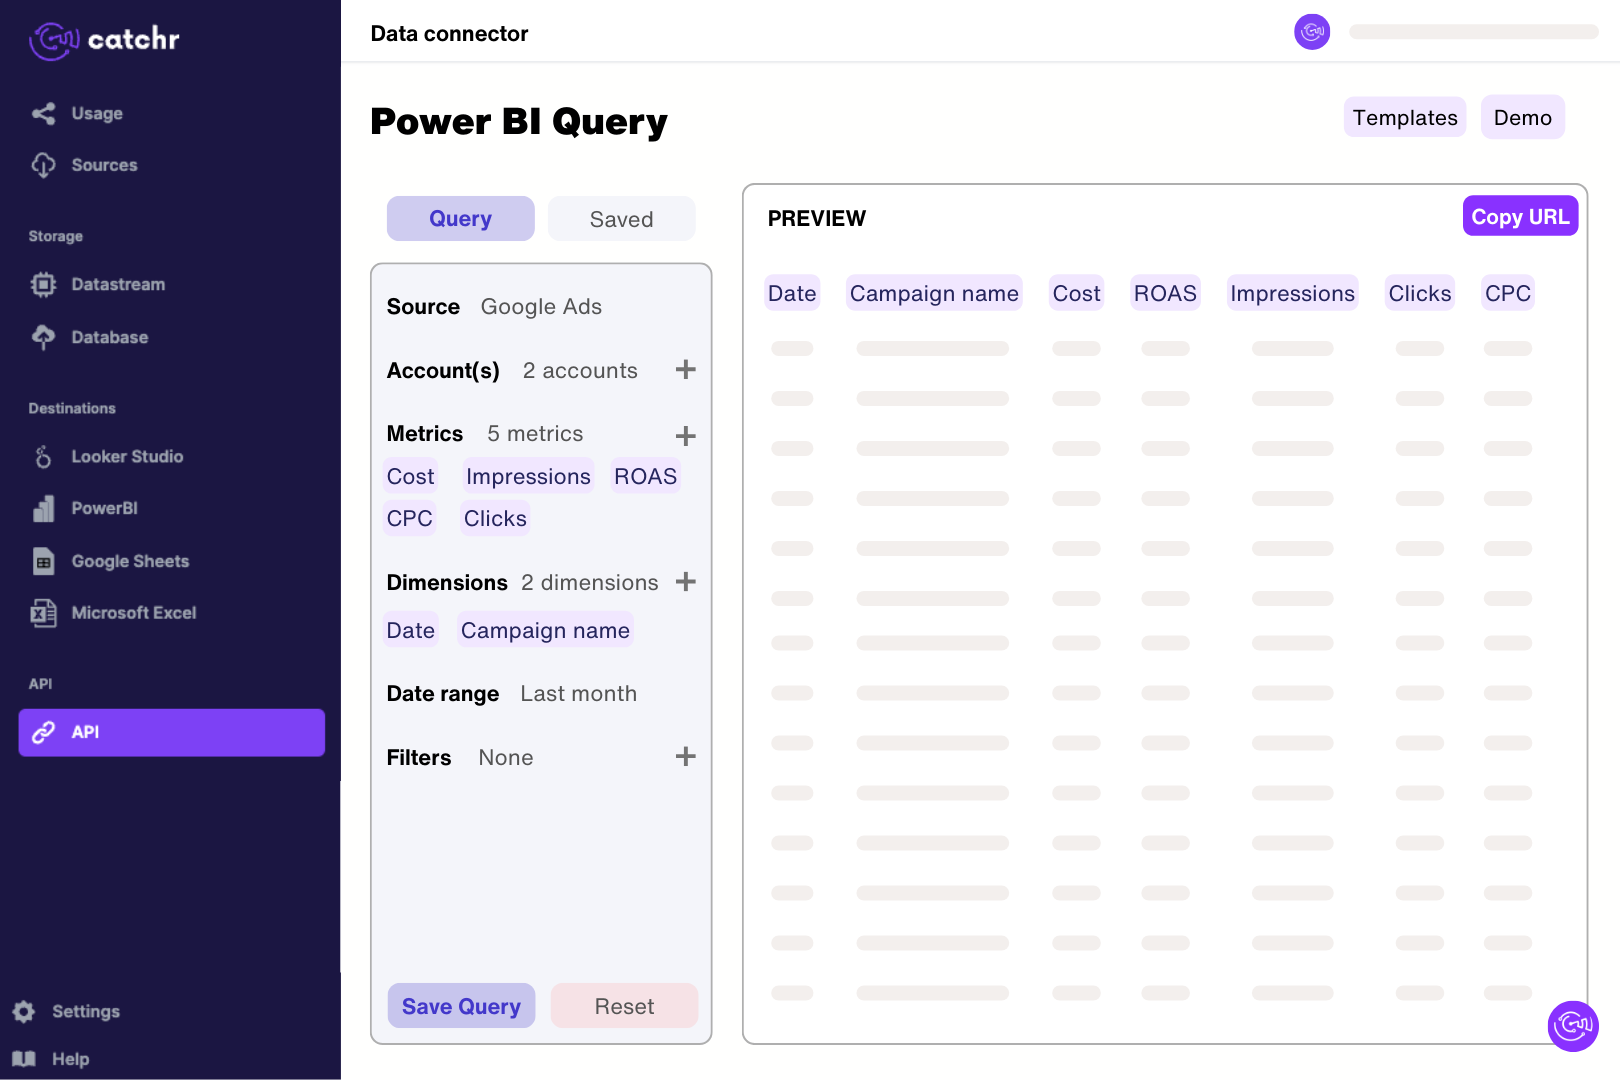
Choose Power BI format, select Amplitude, accounts, fields, date range, filters, and supported options. Preview the response, save the query, and copy its URL.

Step three

Use Get data > Web

In Power BI Desktop, choose Get data > Web, keep Basic selected, paste the complete Catchr URL, confirm, then load or transform the response.

Step four

Shape, model, and refresh

Clean the table in Power Query, add relationships and DAX measures, then publish the report and set its refresh schedule in the Power BI service.

Amplitude to Power BI pricing

Choose your plan by the number of platforms and accounts you report on.

Starter

For freelancers and small teams.

$ 24 /mo

Billed monthly · cancel anytime

Platforms3
Accounts10
Start free trial

Growth

For agencies managing more clients.

$ 239 /mo

Billed monthly · cancel anytime

Platforms10
Accounts100
Start free trial

Scale

For teams reporting at scale.

$ 599 /mo

Billed monthly · cancel anytime

Platforms25
Accounts500
Start free trial

More Power BI connectors

Thank you! Your submission has been received!
Oops! Something went wrong while submitting the form.

Amplitude to Power BI: FAQ

Answers to common questions about connecting data to spreadsheets, dashboards, AI assistants, and reporting tools with Catchr.

How can I connect Amplitude to Power BI?

Connect the Amplitude project you want to analyze in Catchr. In Catchr’s Power BI query builder, select event type, event time and user identifiers and preview a short extraction. Import the generated URL through Get data > Web in Power BI Desktop. Check the returned rows before building measures, keeping event time, upload time and the identity used for user counts clear in the model.

What Amplitude fields are available through Catchr?

Catchr's catalog includes event type, event time, user ID, device ID, session ID, platform, app version and location fields. Event and user properties are also available as structured values. This gives you event-level reporting data rather than an automatic import of Amplitude's saved charts.

Why can Amplitude event time differ from upload time?

An event can occur on a device before it reaches Amplitude's servers. Amplitude exposes separate event and upload timestamps, and its Export API selects data by server upload time. Keep those meanings distinct when reconciling a report, especially after offline activity or a historical backfill.

Will an Amplitude export include events immediately?

Not always. Amplitude documents a delay before newly received events become available through its Export API. Recent exported results can therefore lag the platform's reporting interface. Treat the newest period as provisional instead of assuming that a missing event indicates a tracking failure.

Can I count active users from the exported events?

Yes, if you define the qualifying events and identity rule first. Count users across the full reporting period rather than adding daily unique counts. Anonymous device IDs and logged-in user IDs can represent different identity states, so a simple count may differ from Amplitude's resolved user measure.

Can I recreate retention charts from Amplitude in Power BI?

Event data can support retention analysis, but the calculation must define a starting cohort, a return event and the period in which a user qualifies as retained. A table of daily events is not a retention report by itself. Prepare that cohort logic before visualizing the result.

Can I combine Amplitude with subscription revenue?

Yes. Add a subscription source such as RevenueCat to compare product engagement with subscription performance. Align projects, dates and currency. Use a verified identity mapping if you need customer-level analysis rather than only aggregate trends.

Still have a question?

Our team is always here to answer any questions you may have about our data connector.

Your next report should not start with five exports

Connect your marketing platforms and build a data workflow your entire agency can use.

14 days free-trial
No credit-card required
100+ sources