Starter
For freelancers and small teams.
$ 24 /mo
Billed monthly · cancel anytime
Platforms3
Accounts10
.svg) Impact.com query · Power BI format
Impact.com query · Power BI format
 Impact.com
One source
Impact.com
One source
 Saved query
API URL
Power BI
Web · Import
Saved query
API URL
Power BI
Web · Import
Used by the world's leading companies









Available metrics
Available dimensions
Impact.com
3 advertising accounts
Connected
 Google Ads
2 advertising accounts
Connected
Google Ads
2 advertising accounts
Connected
 Google Analytics 4
1 web property
Connected
Google Analytics 4
1 web property
Connected
 HubSpot
1 CRM portal
Connected
HubSpot
1 CRM portal
Connected

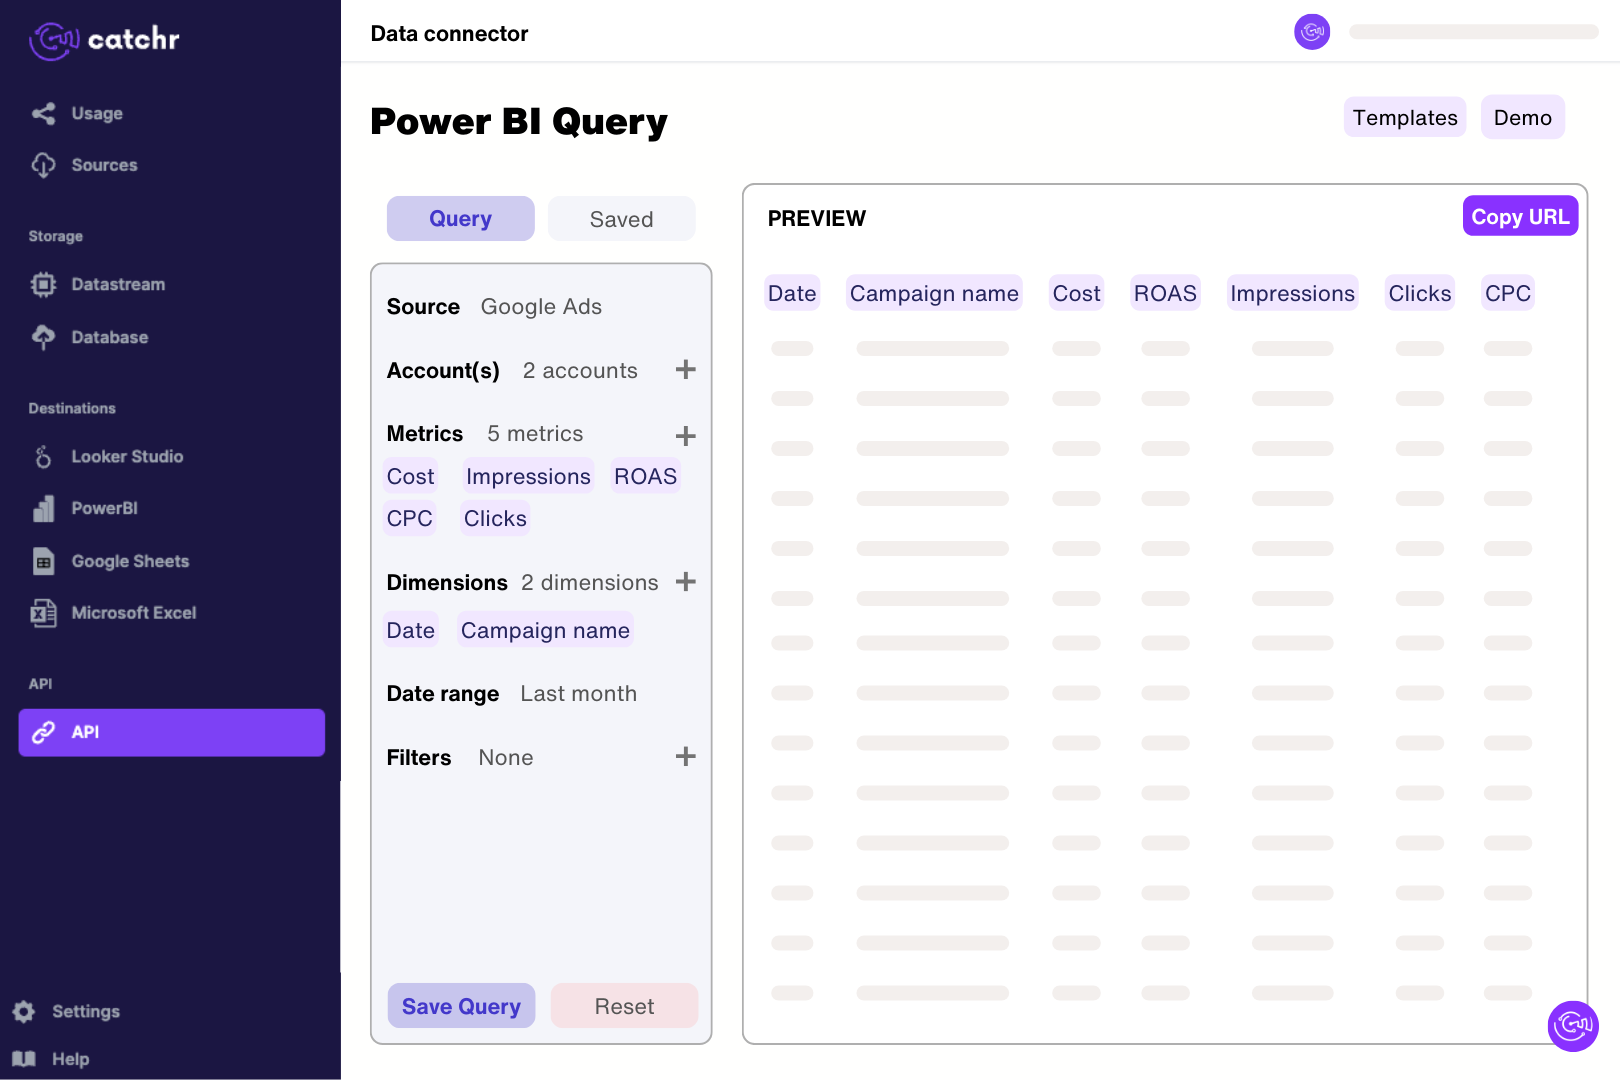
Connect the impact.com brand account in Catchr with its Account SID and Auth Token. Build a Power BI query for the available company, partner, program or ad metadata, preview it and import the generated URL through Get data > Web. Retain the relevant IDs so partner directories and program coverage can be modeled without counting each promotional property as a separate partner.
The current connector exposes company information, partners, programs, ads, and details such as partner properties, promotional methods, and promotional countries. Use these fields to build a partner directory, review program coverage, or organize creative assets. They describe your partnership setup rather than transaction-level performance.
The current Catchr field set does not include tracked actions, sales revenue, or commission payouts. A program setting such as view-through crediting or impression tracking does not provide the corresponding performance count. For a sales or commission dashboard, you need a separate performance dataset with those measures.
Yes. Catchr exposes partner promotional methods, whether a method is primary, promotional countries, and partner properties such as websites or social profiles. These fields help review how your partnership network is structured. A partner can have several methods or properties, so count distinct partner IDs when measuring the number of partners.
Yes. Program IDs, names, states, and tracking settings are available alongside ad names, types, landing pages, and promotion dates. This can help organize banners, text links, and coupons. Creative metadata shows what an asset is and how it is configured; it does not show the clicks or sales generated by that asset.
Adding promotional countries, methods, properties, or program relationships can produce several rows for the same partner. A row count then measures combinations rather than individual partners. Use distinct partner IDs for a partner count and inspect a sample partner before interpreting totals in a more detailed table.
Yes. You can place partner information alongside sources such as Google Analytics 4 in one report. To connect partner records with website performance, use an explicit mapping from partner IDs to your tracking values. A shared dashboard alone does not attribute website conversions to impact.com partners.
Use a partner table keyed by partner ID and separate tables for repeating promotional methods, countries or properties when needed. Count distinct partners rather than relationship rows. This model supports analysis of the partner network currently exposed by Catchr; it cannot calculate sales, commissions or return on spend when the imported dataset contains no such performance measures.
Our team is always here to answer any questions you may have about our data connector.
Connect your marketing platforms and build a data workflow your entire agency can use.





.svg)



























.png)




.svg)