Starter
For freelancers and small teams.
$ 24 /mo
Billed monthly · cancel anytime
Platforms3
Accounts10
.svg) Amazon Seller query · Power BI format
Amazon Seller query · Power BI format
 Amazon Seller
One source
Amazon Seller
One source
 Saved query
API URL
Power BI
Web · Import
Saved query
API URL
Power BI
Web · Import
Used by the world's leading companies









Available metrics
Available dimensions
Amazon Seller
3 advertising accounts
Connected
 Google Ads
2 advertising accounts
Connected
Google Ads
2 advertising accounts
Connected
 Google Analytics 4
1 web property
Connected
Google Analytics 4
1 web property
Connected
 HubSpot
1 CRM portal
Connected
HubSpot
1 CRM portal
Connected

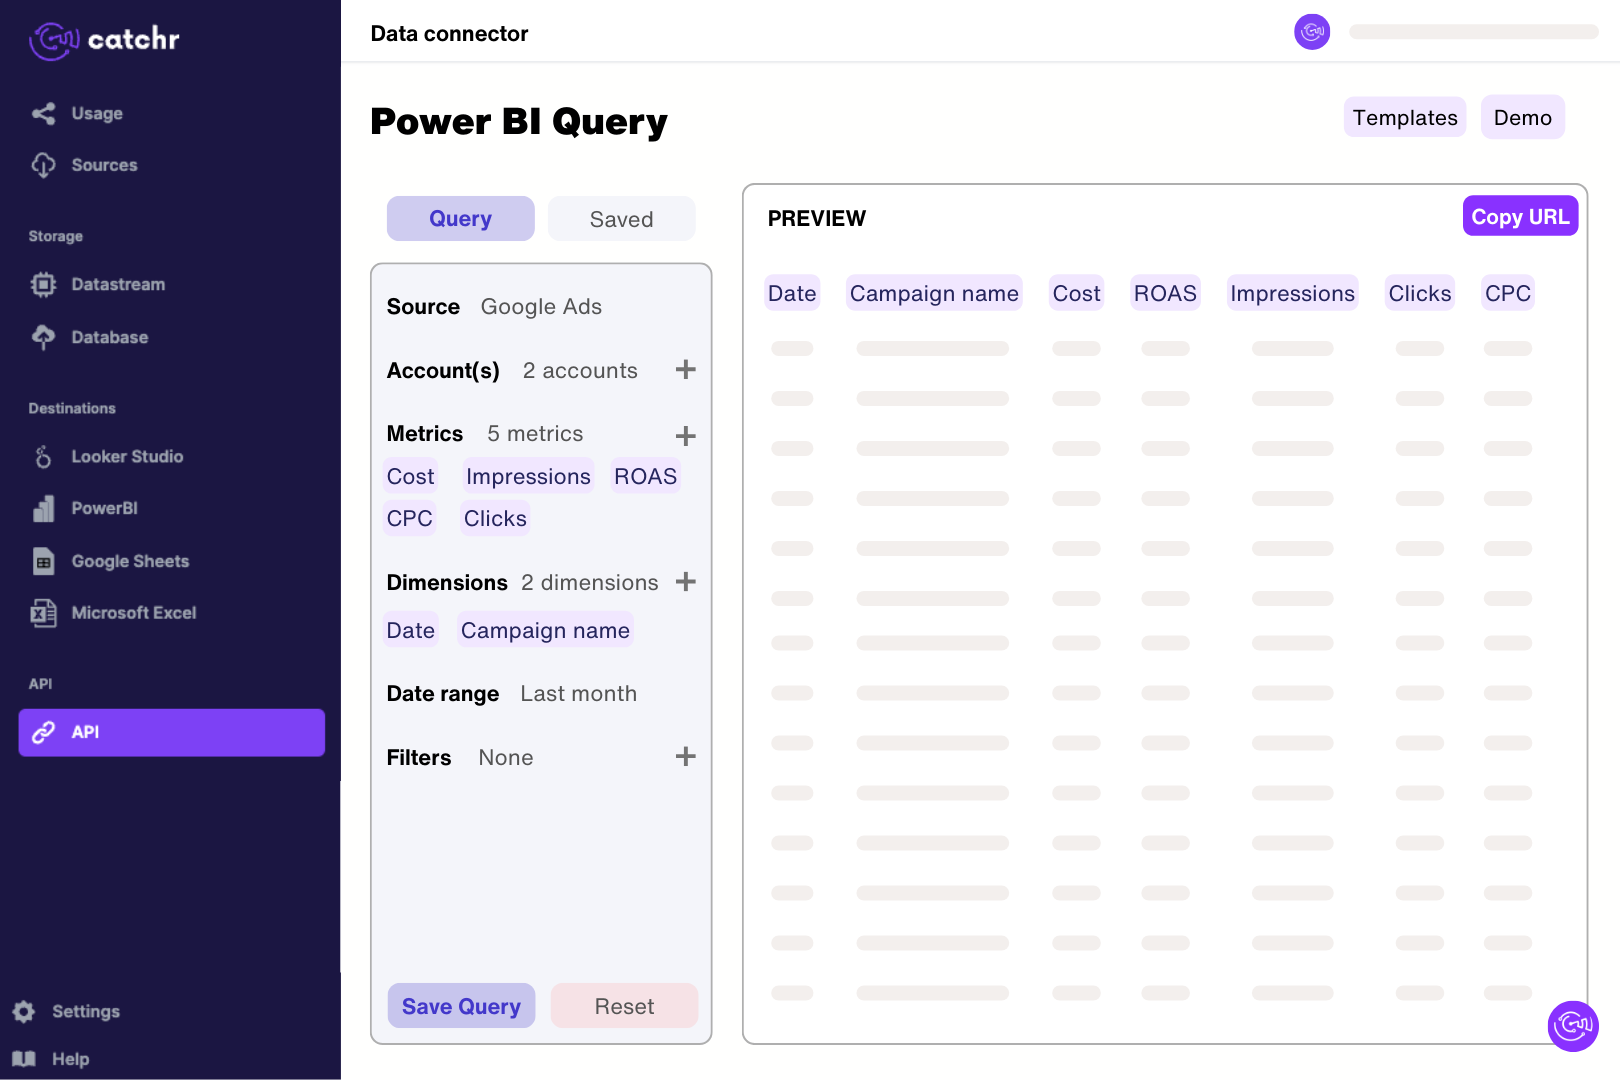
Authorize your Seller Central account in Catchr, then select the marketplace and orders or sales-and-traffic report. In Catchr’s Power BI query builder, select a completed period from one report and preview a short extraction. Import the generated URL through Get data > Web in Power BI Desktop. Check the returned rows before building measures, keeping marketplace and distinct report grains when combining retail measures clear in the model.
The sales and traffic report covers metrics such as ordered product sales, units ordered, sessions, page views and Buy Box percentage, including available B2B fields. The orders report provides order identifiers, purchase dates, statuses, product details, fulfillment information and monetary components. These are separate report families; select the one that answers the question your chart is meant to show.
Not in one Catchr request. The connector rejects a query that mixes order fields with the sales and traffic field family. Create separate data sources or charts for order analysis and business performance. If you join their results later in Power BI, first aggregate to a compatible level so each order line does not repeat an entire day's sales or sessions.
Yes. The connector selects Amazon's product grouping from the requested parent ASIN, child ASIN or SKU fields. ASIN results summarize the requested period; they are separate from the daily sales and traffic rows. Use a product table for the period and a separate date-based chart for trends. Do not assume that adding a date to a product table produces daily performance for every ASIN.
Check the marketplace, currency, date range, order status and whether the measure is ordered sales, shipped sales or an order-line amount. Count distinct Amazon order IDs for orders rather than counting every product row as a separate order. A sales or order report is not a settlement statement: fees, refunds and other adjustments can make the payout different. Reconcile monetary components before calling a calculated total net revenue or profit.
Amazon's Sales and Traffic Business Report limits the start date to the previous two years. This limit applies to that report, not automatically to every order report. Amazon generates reports asynchronously, and Catchr can reuse cached results, so refreshing a dashboard does not guarantee newly generated source data. Use completed periods for comparisons and check against Seller Central if recent figures appear incomplete or stale.
Use the Amazon Ads connector for advertising spend and attributed results. Seller Central sales include a broader retail scope and should not be treated as ad-attributed revenue. You can compare total seller sales with ad spend in one dashboard, but label that ratio separately from campaign ROAS. Vendor retail reporting is also a separate source: Amazon Vendor Central.
Our team is always here to answer any questions you may have about our data connector.
Connect your marketing platforms and build a data workflow your entire agency can use.





.svg)




























.png)


.svg)