Starter
For freelancers and small teams.
$ 24 /mo
Billed monthly · cancel anytime
Platforms3
Accounts10
.svg) Profitwell query · Power BI format
Profitwell query · Power BI format
 Profitwell
One source
Profitwell
One source
 Saved query
API URL
Power BI
Web · Import
Saved query
API URL
Power BI
Web · Import
Used by the world's leading companies









Available metrics
Available dimensions
Profitwell
3 advertising accounts
Connected
 Google Ads
2 advertising accounts
Connected
Google Ads
2 advertising accounts
Connected
 Google Analytics 4
1 web property
Connected
Google Analytics 4
1 web property
Connected
 HubSpot
1 CRM portal
Connected
HubSpot
1 CRM portal
Connected

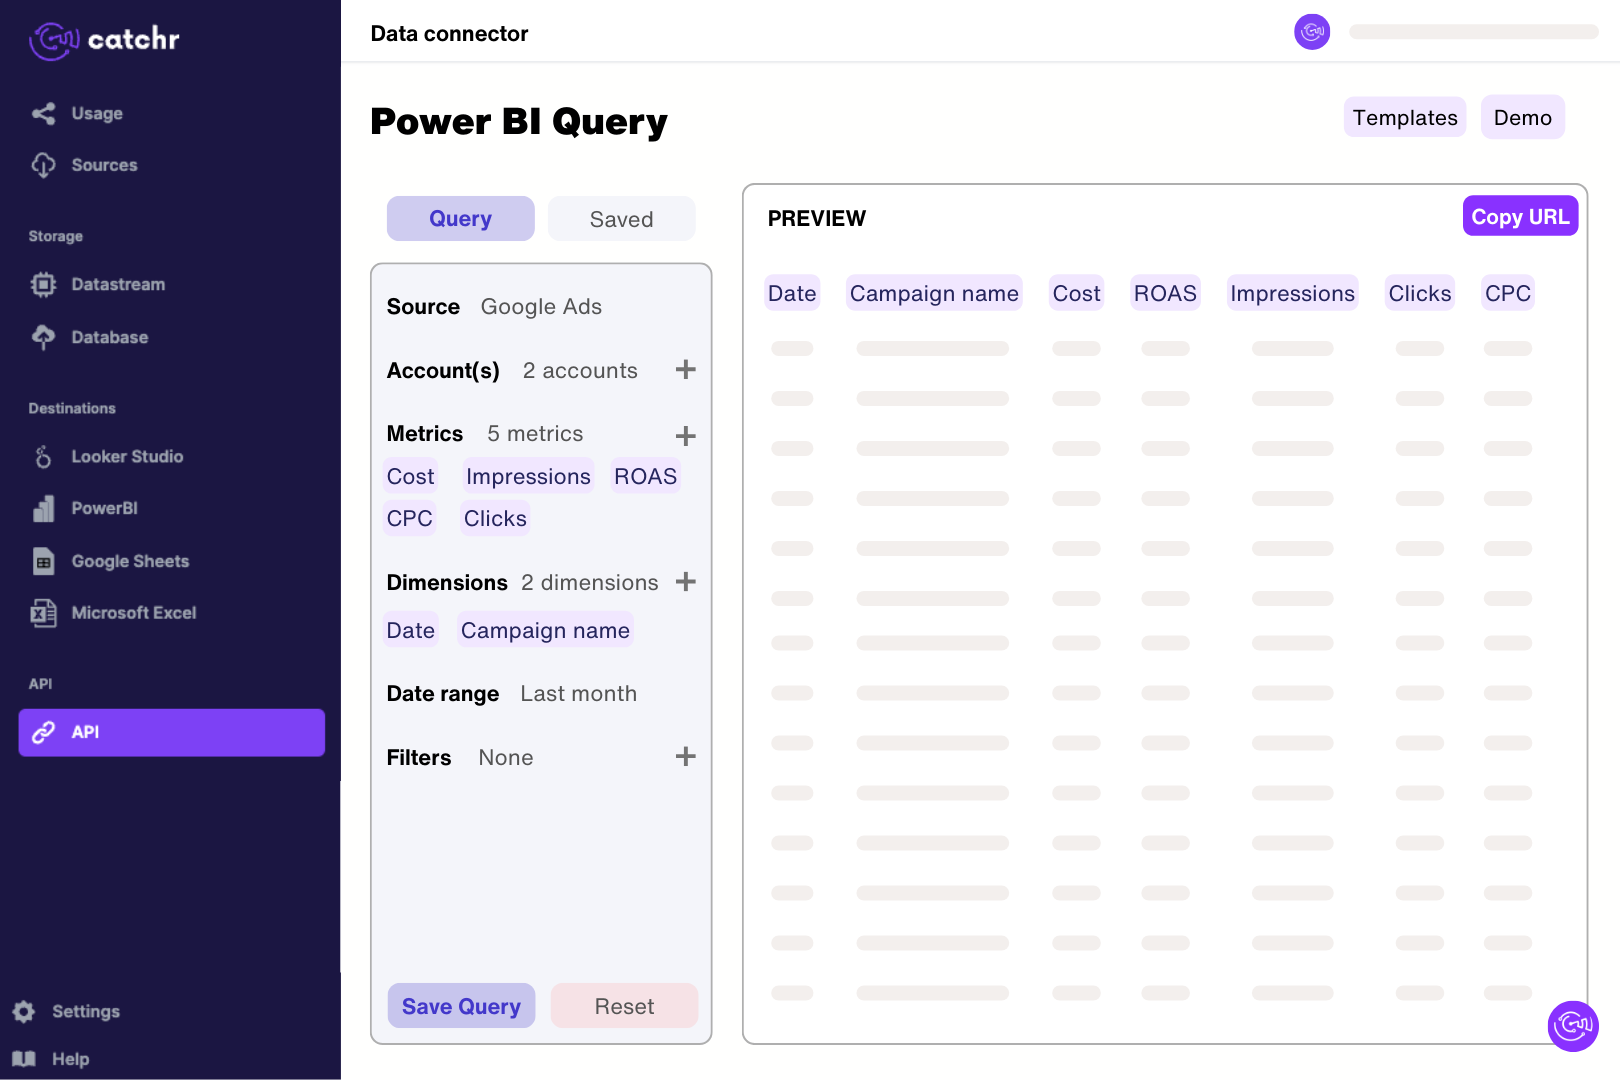
Connect ProfitWell in Catchr using its API key and select the available account. In Catchr’s Power BI query builder, select monthly recurring revenue and active customers and preview a short extraction. Import the generated URL through Get data > Web in Power BI Desktop. Check the returned rows before building measures, keeping month, currency and monetary units clear in the model.
Catchr exposes recurring revenue, active and trialing customers, new and reactivated customers, upgrades, downgrades, churn and retention metrics. Customer-level fields include status, activation and churn dates, Customer MRR and Customer Total Spend. Use the metrics dataset for business trends and customer records for customer analysis; they do not have the same level of detail.
No. MRR expresses subscription value on a monthly basis. For example, a yearly subscription paid upfront contributes a monthly share to MRR while the cash is collected at payment time. One-time purchases are not recurring revenue. Keep MRR trends separate from payment totals when comparing ProfitWell with a billing source such as Stripe.
No. MRR and active-customer figures describe a level at a point in time, so adding daily values repeatedly counts that level. Use the appropriate monthly metric or a clearly defined period-end value. Catchr’s total-granularity response uses the latest returned daily metric row rather than summing every day; keep that distinction in mind when comparing a scorecard with a time series.
Cancellation churn comes from customers choosing to leave, while delinquent churn relates to failed billing. Catchr exposes separate customer and recurring-revenue measures for both. A cancellation request may happen before the paid subscription period ends, so it need not reduce current MRR immediately. Future Churn MRR describes scheduled loss and should not be added to revenue already churned.
The API distinguishes monthly history from daily detail. Its documented daily-metrics endpoint is limited to the current or previous month, while monthly metrics support longer-term analysis. Use monthly reporting for older trends instead of expecting historical day-by-day data from the same endpoint. Availability also depends on the history stored in your ProfitWell account.
Check the period, daily versus monthly view, metric definition, currency and chart aggregation first. Also verify percentage and monetary units against a known value. If a figure differs by a consistent factor such as 100, investigate field conversion and formatting before using it for decisions. Customer MRR, total spend and company recurring revenue are distinct measures and should not be substituted for one another.
Our team is always here to answer any questions you may have about our data connector.
Connect your marketing platforms and build a data workflow your entire agency can use.





.svg)




























.png)




.svg)