Starter
For freelancers and small teams.
$ 24 /mo
Billed monthly · cancel anytime
Platforms3
Accounts10
.svg) Capterra Review query · Power BI format
Capterra Review query · Power BI format
 Capterra Review
One source
Capterra Review
One source
 Saved query
API URL
Power BI
Web · Import
Saved query
API URL
Power BI
Web · Import









Available metrics
Available dimensions
Capterra Review
3 advertising accounts
Connected
 Google Ads
2 advertising accounts
Connected
Google Ads
2 advertising accounts
Connected
 Google Analytics 4
1 web property
Connected
Google Analytics 4
1 web property
Connected
 HubSpot
1 CRM portal
Connected
HubSpot
1 CRM portal
Connected

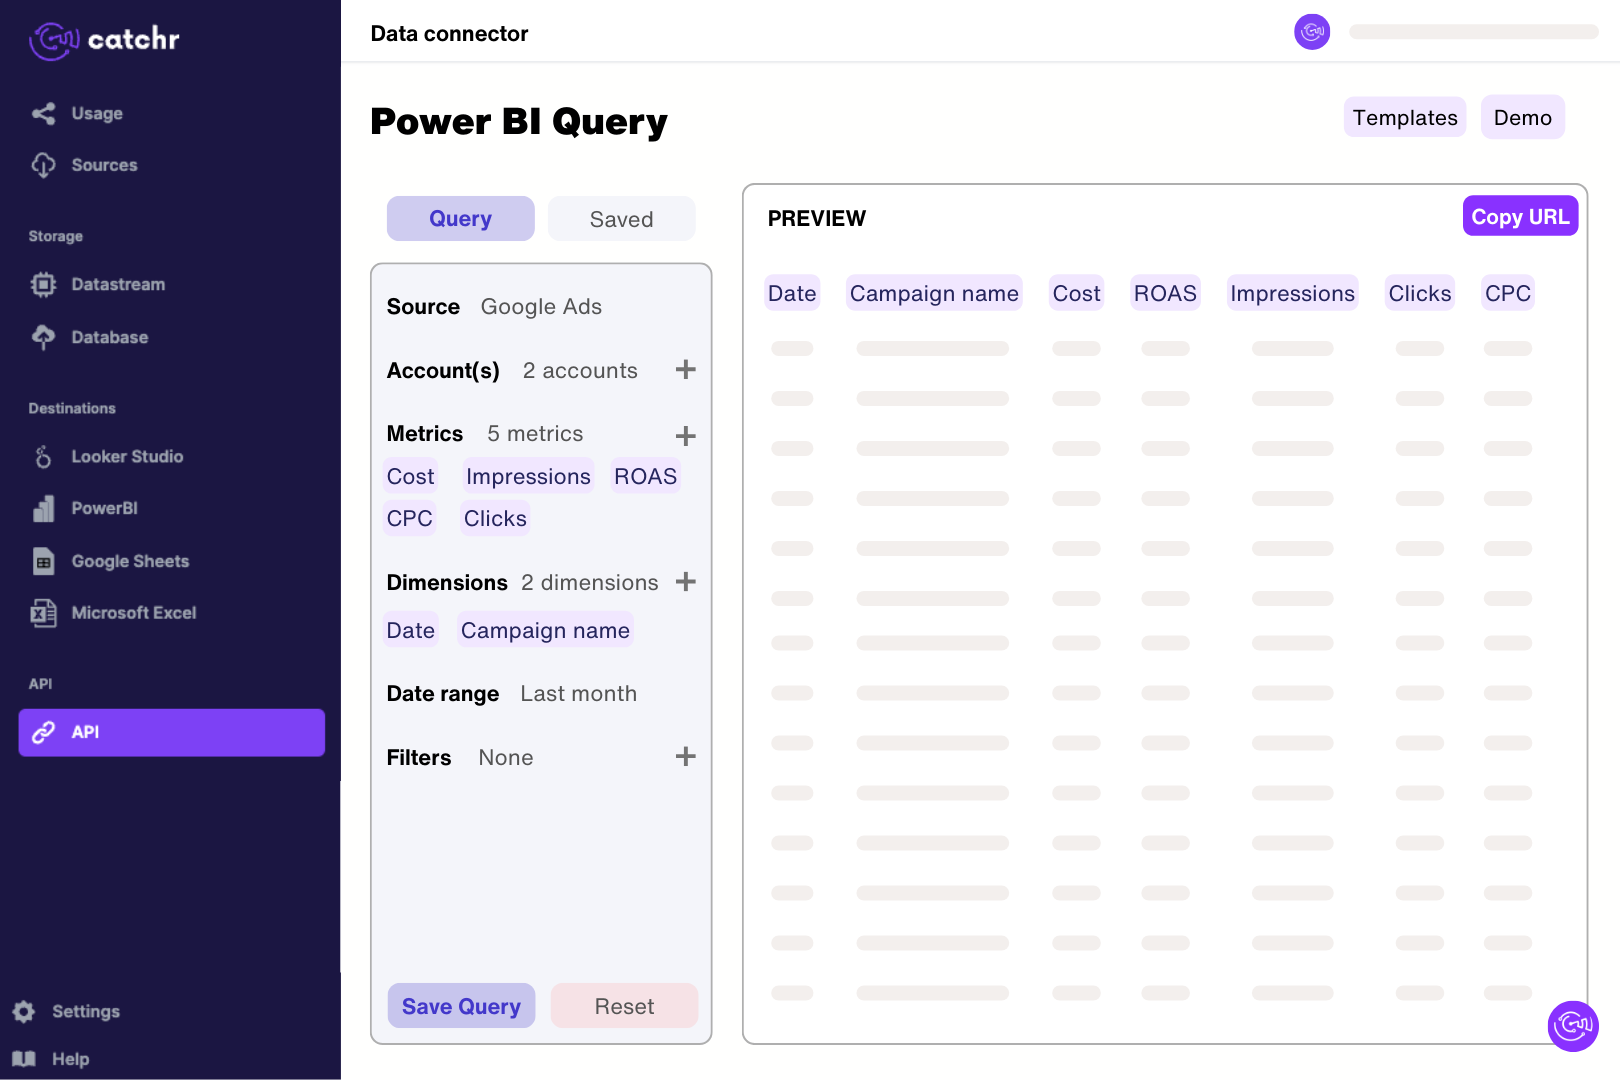
Add the review source in Catchr using the numeric product ID after /p/. Select the configured profile, app or property. Build a Power BI query with Review Title, Rating and Review DateTime, preview the returned reviews and import the generated URL using Get data > Web in Power BI Desktop. Set review dates and rating types in Power Query, and retain the source identifier when combining several profiles.
Yes. Catchr exposes Pros and Cons as separate text fields alongside the review title, rating, date, reviewer, and review URL. Build a table for recent reviews and filter it to investigate themes such as onboarding, support, or missing features. You can create your own keyword groups, but they are your analysis rather than a native Capterra sentiment score. Keep the original review link so your team can read the context behind a complaint or positive comment.
Individual reviews have a Rating field. Separate product summaries include Overall Rating, Ease of Use Rating, Customer Service Rating, Functionality Rating, Value for Money Rating, and Review Count. These summary ratings describe the product as a whole; they are not category ratings attached to each individual review. Keep summary scorecards separate from tables containing review dates, titles, or Pros and Cons, because Catchr does not support requesting both types of fields together.
Group individual reviews by Review DateTime and count distinct Review IDs for each month. Use an average of valid Rating values rather than a sum to show how the retrieved reviews scored during that period. The product-level Review Count is a current total and should not be plotted as if it were the number of reviews received each month. Display the sample size beside the average, especially when comparing a quiet month with a major review-collection campaign.
First check whether your chart uses individual reviews for a selected period or a current product summary. These cover different sets of reviews. Then check the raw value, field format, and aggregation: a star rating should not be summed, and a number formatted as a percentage can look very different from the corresponding score on Capterra. Validate one product and one rating field against its page before copying the scorecard across a larger dashboard.
One request is not an unlimited archive. Catchr retrieves Capterra reviews in pages of 25 and stops paging after roughly 1,000 matching reviews, when available results end, or when it reaches the requested date boundary. Use smaller review-date periods for high-volume products and check the oldest and newest records returned. The product's total Review Count can therefore be higher than the number of review rows in your report.
Yes. Add a separate G2 reviews data source and map the matching product profiles. Compare recent review volume, average review ratings, and recurring feedback side by side while retaining the platform and date range. Do not assume that a Capterra category rating equals a similarly named G2 score. If you combine raw reviews, use the platform, product identifier, and Review ID together to avoid merging unrelated records.
Our team is always here to answer any questions you may have about our data connector.
Connect your marketing platforms and build a data workflow your entire agency can use.





.svg)




























.png)




.svg)