Starter
For freelancers and small teams.
$ 24 /mo
Billed monthly · cancel anytime
Platforms3
Accounts10
.svg) Google Ad Manager query · Power BI format
Google Ad Manager query · Power BI format
 Google Ad Manager
One source
Google Ad Manager
One source
 Saved query
API URL
Power BI
Web · Import
Saved query
API URL
Power BI
Web · Import
Used by the world's leading companies









Available metrics
Available dimensions
Google Ad Manager
3 advertising accounts
Connected
 Google Ads
2 advertising accounts
Connected
Google Ads
2 advertising accounts
Connected
 Google Analytics 4
1 web property
Connected
Google Analytics 4
1 web property
Connected
 HubSpot
1 CRM portal
Connected
HubSpot
1 CRM portal
Connected

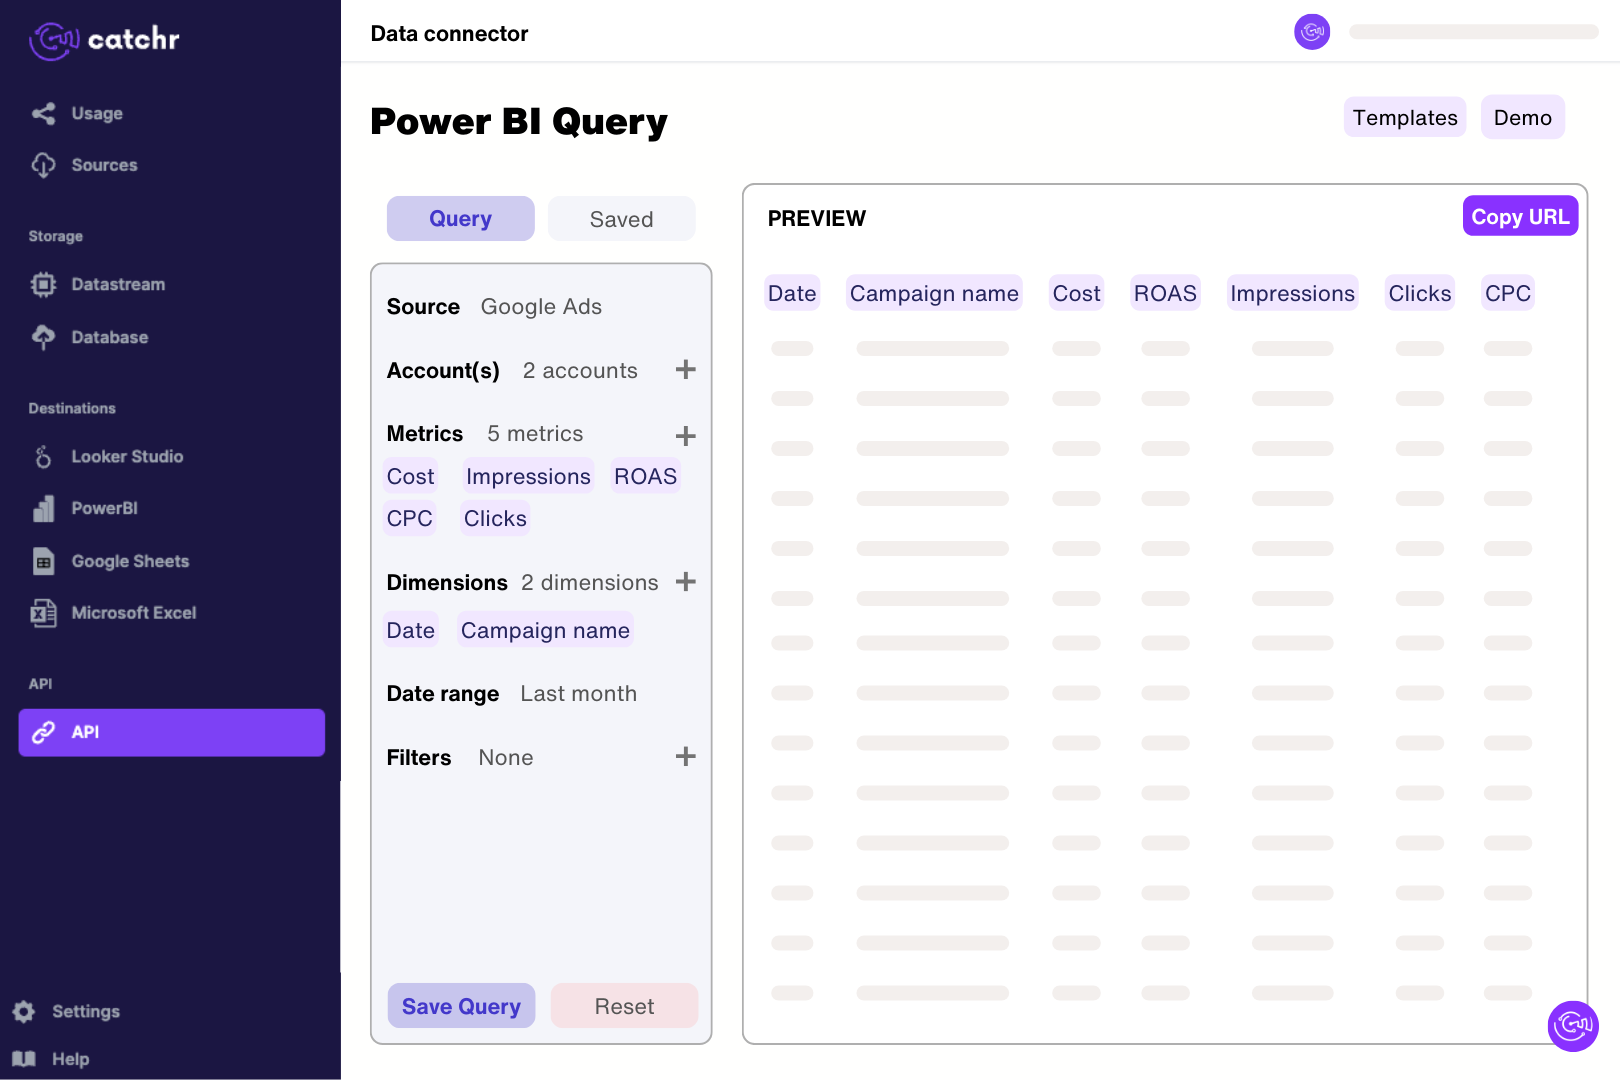
Authorize a Google user with access to the publisher network and select that network in Catchr. In Catchr’s Power BI query builder, select Date, Impressions and Revenue and preview a short extraction. Import the generated URL through Get data > Web in Power BI Desktop. Check the returned rows before building measures, keeping network, currency and the chosen revenue family clear in the model.
No. Google Ad Manager reports on the advertising inventory a publisher sells, including delivery and revenue. Google Ads reports on campaigns an advertiser buys, including spend and conversions. Use this connector to analyze your publisher network. To report on paid search or other campaigns purchased through Google Ads, use the Google Ads connector for Power BI. Ad Manager revenue and advertiser spend measure different sides of the advertising transaction.
Catchr builds a historical reporting request for your selected network, dates and compatible fields. Import its generated URL through Power BI's Web connector, then use Power Query to set dates and numeric types. A saved Ad Manager report ID is not the connection input, and the eligibility of Google's separate Looker Studio connector does not determine how this Power BI workflow operates.
Catchr builds a historical report from the dimensions, metrics, and date range selected in your Catchr query. Its current connection does not import a saved report by pasting its report ID. To reproduce an existing Ad Manager report, select the corresponding fields and apply the same dates and filters in Power BI. A saved report's custom fields or settings will not automatically transfer to the Catchr data source.
Catchr's catalog includes impressions, clicks, revenue, average eCPM, unfilled impressions, and Active View metrics, with dimensions such as date, ad unit, line item, and country. Separate metric families cover ad server, AdSense, and Ad Exchange reporting. Availability depends on your network and the combinations accepted by Ad Manager. Build a delivery overview first, then separate inventory, demand, and viewability analysis into focused charts instead of placing every field in one table.
For an eCPM calculated from revenue and impressions, divide total revenue by the matching impression total and multiply by 1,000. Keep both metrics in the same reporting family and currency. Active View viewability uses viewable impressions divided by measurable impressions, rather than all delivered impressions. Handle zero denominators as unavailable. When combining days or ad units, calculate these ratios from the summed components instead of averaging the daily eCPM or viewability percentages.
Compare the same network, dates, filters, and metric definitions. Catchr requests historical reports using the publisher time zone; its network metadata also exposes the time zone and currency to help you check the comparison. Total revenue, ad server revenue, and revenue excluding CPD are different fields. Avoid adding a total to its component channels, and check whether one report includes recent data that the other has not refreshed yet. When comparing networks, keep different currencies separate or convert them explicitly.
Catchr waits for Ad Manager to generate a report before fetching its results. Large date ranges and detailed combinations such as date, ad unit, and line item can produce much larger reports. Start with a short period and a few fields, then expand gradually. If adding one dimension makes a working chart fail, check its compatibility with the selected metrics and your network's access. A field appearing in the catalog does not mean it can be combined with every other field.
Our team is always here to answer any questions you may have about our data connector.
Connect your marketing platforms and build a data workflow your entire agency can use.





.svg)



























.png)




.svg)