Starter
For freelancers and small teams.
$ 24 /mo
Billed monthly · cancel anytime
Platforms3
Accounts10
.svg) StackAdapt query · Power BI format
StackAdapt query · Power BI format
 StackAdapt
One source
StackAdapt
One source
 Saved query
API URL
Power BI
Web · Import
Saved query
API URL
Power BI
Web · Import
Used by the world's leading companies









Available metrics
Available dimensions
StackAdapt
3 advertising accounts
Connected
 Google Ads
2 advertising accounts
Connected
Google Ads
2 advertising accounts
Connected
 Google Analytics 4
1 web property
Connected
Google Analytics 4
1 web property
Connected
 HubSpot
1 CRM portal
Connected
HubSpot
1 CRM portal
Connected

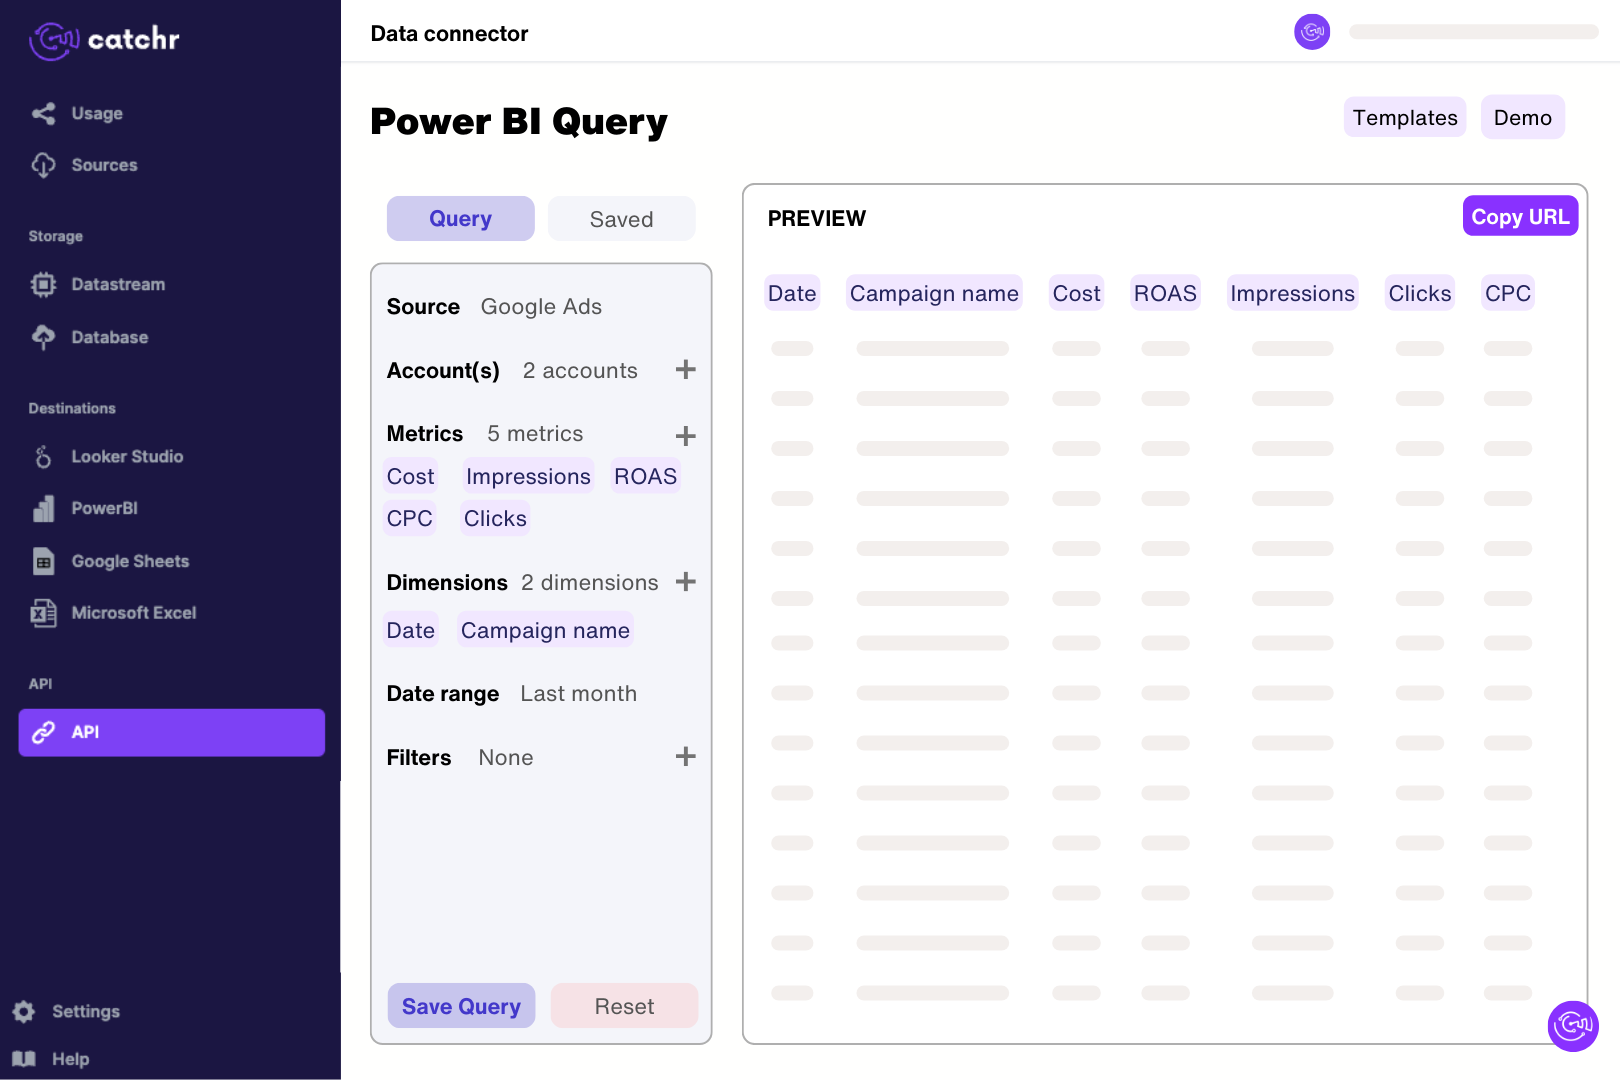
Use your StackAdapt API key to connect Catchr and select an accessible advertiser. In Catchr’s Power BI query builder, select Campaign Name, Impressions, Clicks and Cost and preview a short extraction. Import the generated URL through Get data > Web in Power BI Desktop. Check the returned rows before building measures, keeping advertiser, reporting currency and conversion definitions clear in the model.
Catchr includes Cost, Impressions, Clicks, CTR, Conversions, Conversion Revenue, ROAS and efficiency measures such as eCPM and eCPA. It also exposes campaign groups, campaigns, channel names and campaign status, plus video and audio playback metrics. Choose fields that fit the channel and campaign goal; video or audio measures are not meaningful for every campaign.
Yes. The catalog includes Click Conversions and Impression Conversions, plus separate secondary-conversion fields. Match the conversion family to the outcome you are measuring and the StackAdapt column you are comparing. Do not add a total to its components or combine primary and secondary outcomes as if they were all purchases. Use clear labels when showing more than one conversion measure.
Catchr exposes these as distinct StackAdapt fields. Use Conversion Revenue for the value associated with tracked conversion events, and confirm that values are configured for those events. Do not substitute the separate Revenue field simply because its name sounds similar. When validating ROAS, check the conversion value, cost basis and attribution settings used by the corresponding platform report.
Yes. Video and audio each have starts, quartile playback counts, completions and completion-rate fields. Use the matching family for each channel and keep video and audio charts separately labelled. For a combined rate across campaigns, use matching total completions and starts rather than a simple average of campaign percentages; a low-volume campaign should not carry the same weight as a high-volume one.
StackAdapt and GA4 can credit different touchpoints, use different attribution windows and record different conversion events. Compare the same outcome and dates, then check whether StackAdapt includes impression-based conversions. Confirm tracking and event values before interpreting a gap as missing sales. A reporting connector retrieves platform results; it does not reconcile different attribution models automatically.
Yes. Add the Google Ads connector alongside StackAdapt and align dates, currencies and cost definitions. Compare channel delivery and efficiency, while keeping attributed conversions identified by platform. For overall unique sales, use a consistent business-level source rather than summing conversion claims from platforms that may both credit the same purchase.
Our team is always here to answer any questions you may have about our data connector.
Connect your marketing platforms and build a data workflow your entire agency can use.





.svg)



























.png)




.svg)