Starter
For freelancers and small teams.
$ 24 /mo
Billed monthly · cancel anytime
Platforms3
Accounts10
 Twitter Ads query · Power BI format
 Twitter Ads
One source
 Saved query
API URL
Power BI
Web · Import
Used by the world's leading companies









Available metrics
Available dimensions
Twitter Ads
3 advertising accounts
Connected
 Google Ads
2 advertising accounts
Connected
 Google Analytics 4
1 web property
Connected
 HubSpot
1 CRM portal
Connected

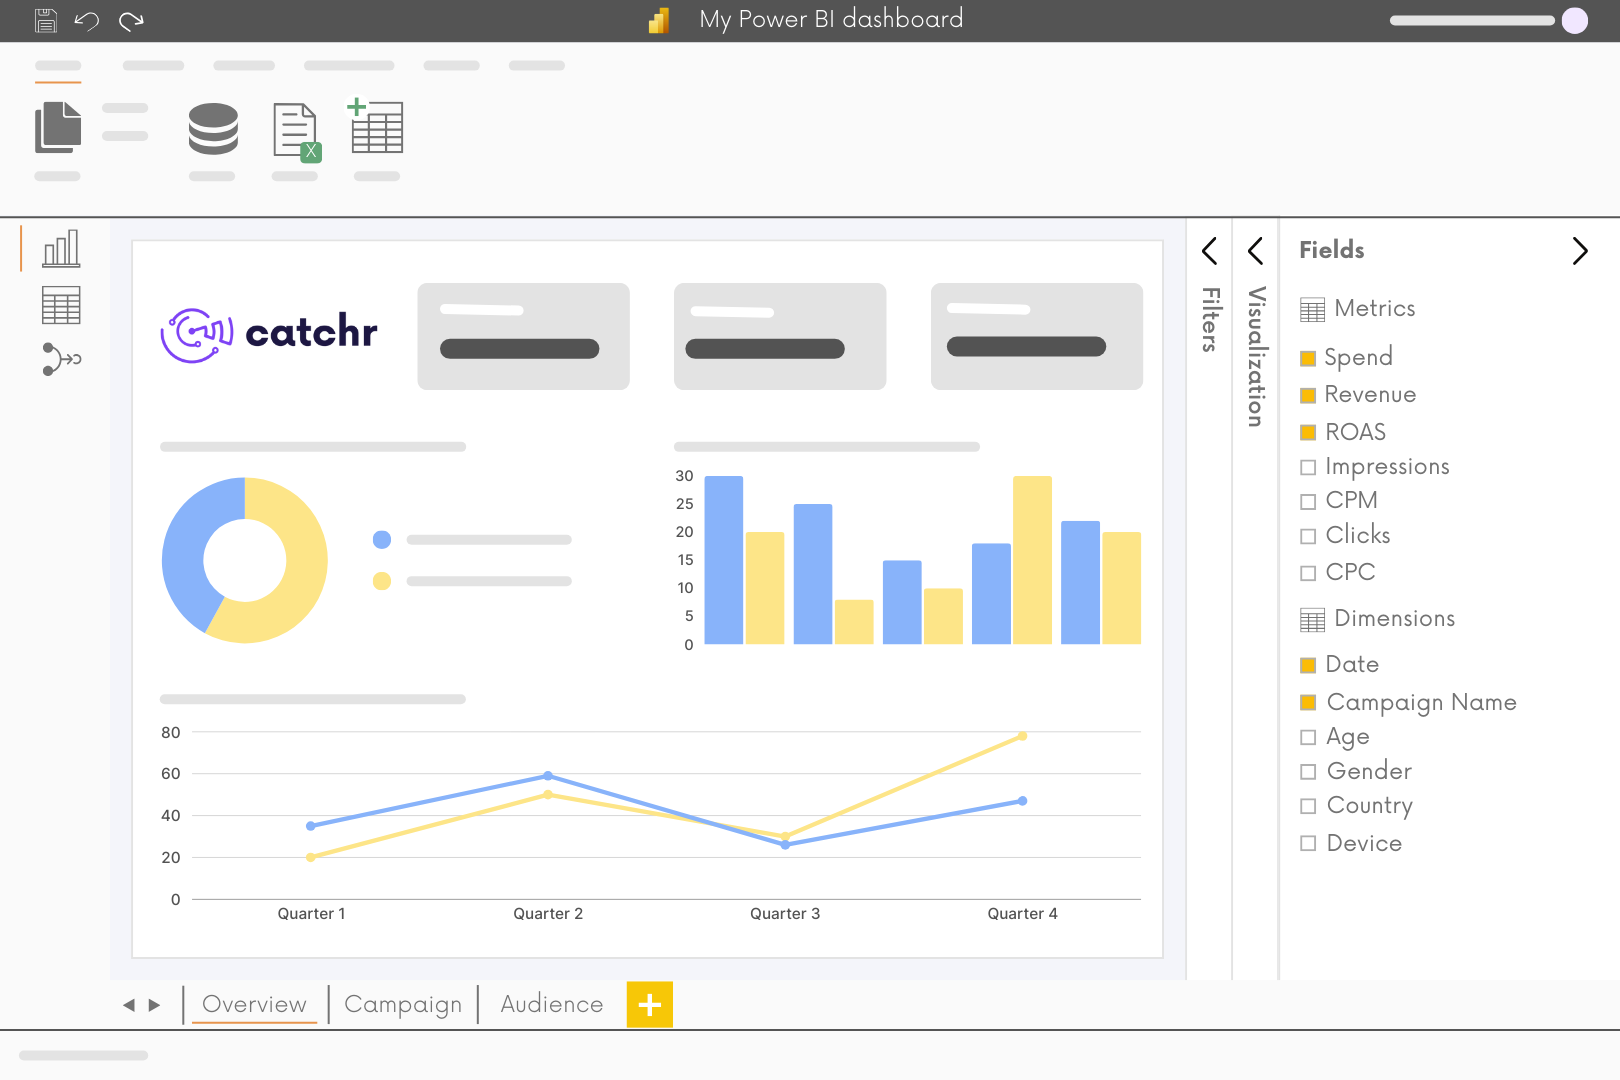
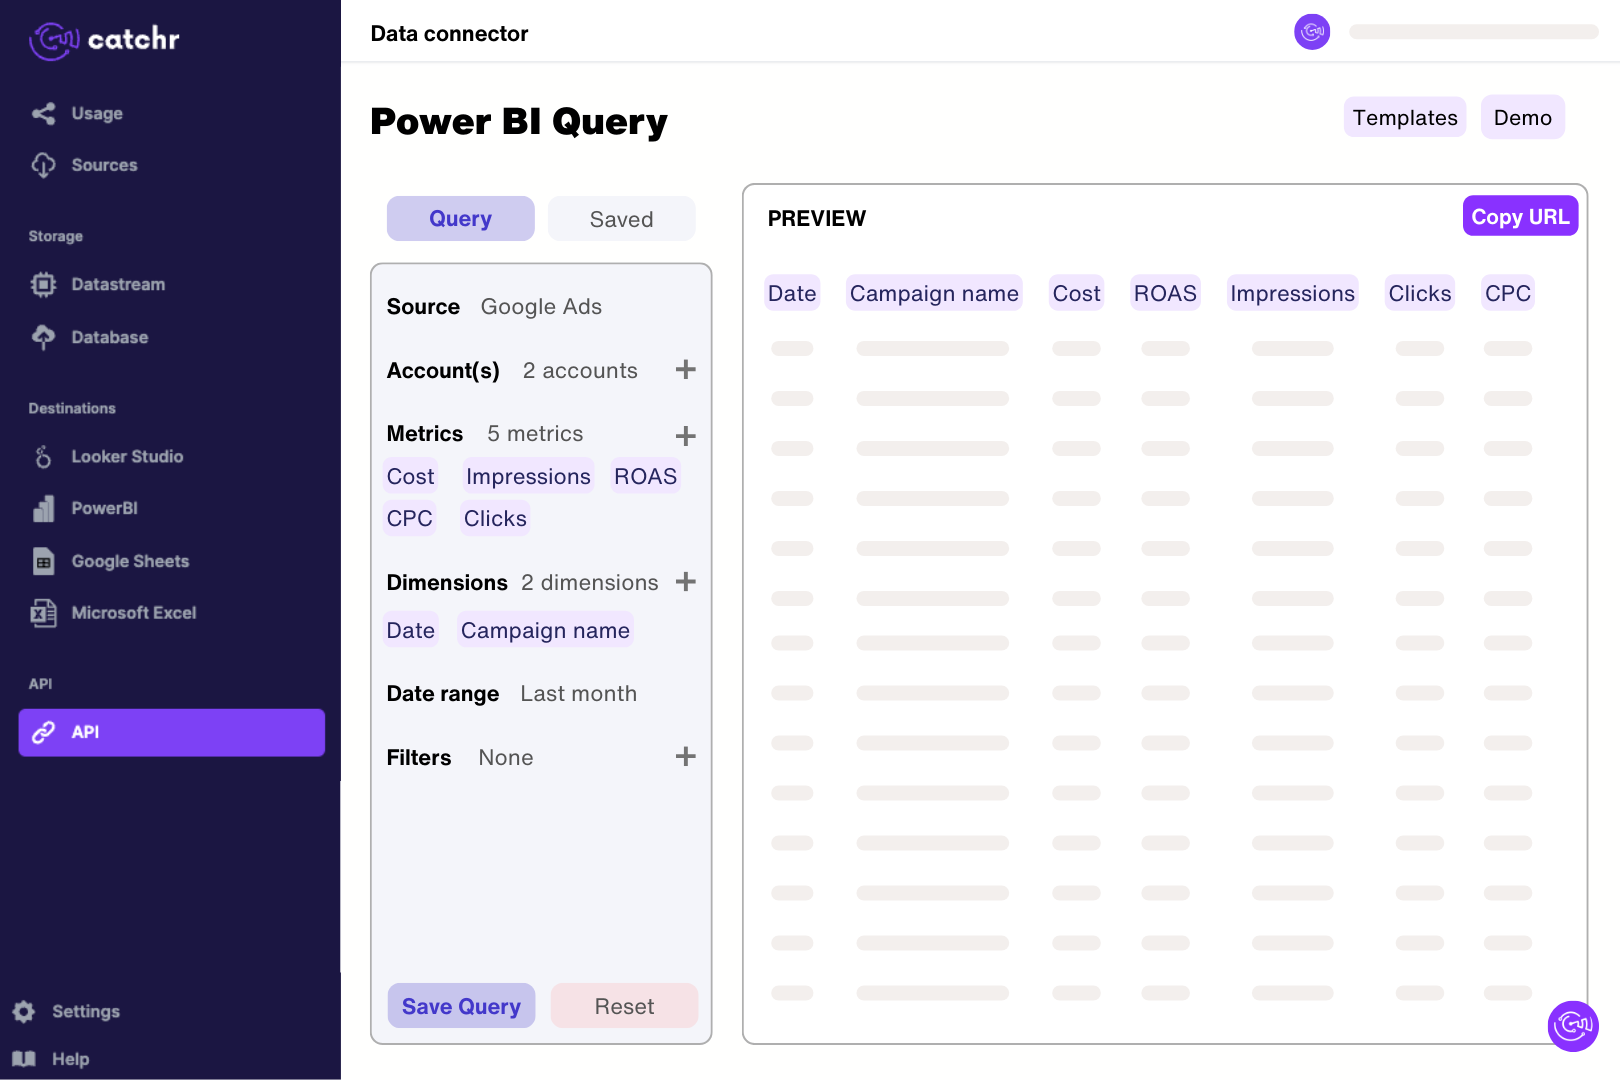
Connect the X account that can access the advertising account through Catchr's Twitter Ads source. In Catchr’s Power BI query builder, select a daily campaign table for a completed period and preview a short extraction. Import the generated URL through Get data > Web in Power BI Desktop. Check the returned rows before building measures, keeping on-X placement scope and the exact conversion metric clear in the model.
The connector requests engagement, billing, video, media, web conversion and mobile conversion data. You can report by account, campaign, ad group or promoted post using the fields available at that level. Choose metrics that match the campaign objective: an engagement campaign and an app campaign should not be judged by the same result column.
No. X's Clicks metric includes interactions beyond visits to your website. URL clicks specifically measure clicks on an ad's link or Website Card, including earned clicks. For a traffic dashboard, use the link-click metric consistently in both CTR and cost-per-click calculations. Label engagement rate separately so a high interaction rate is not mistaken for a high website visit rate.
This source is built around advertising accounts, campaigns and promoted posts. It is not a complete organic profile analytics feed. Use the separate Twitter public data source for its supported public account and post statistics, and keep those figures separate from paid reporting. A post appearing in an ads report does not make its metrics interchangeable with public lifetime counters.
Compare a specific conversion event, not an unlabelled total of different actions. Check dates, attribution rules and whether you are reading web or mobile conversions, then reconcile the chosen event against an X Ads export. Google Analytics uses its own measurement and attribution, so totals can differ. Validate purchase counts and revenue units before using them in a client-facing CPA or ROAS calculation.
Check the advertising account, campaign level, placement scope, date boundaries and exact metric name. Catchr's reporting requests use the on-X placement scope, so a differently scoped native report may not match. Compare daily rows over a completed period rather than just the grand total. If the first or last day appears shifted, or a conversion value is implausible, send Catchr the date range, field names and matching export for investigation before relying on the chart.
Catchr retrieves reports through X's asynchronous analytics jobs: a report must finish before its results can be read. That is not a live event stream, and X can later revise historical figures, including billing adjustments. Allow the query to finish, refresh the dashboard when needed, and use completed periods for regular client comparisons rather than treating the current day's values as final.
Our team is always here to answer any questions you may have about our data connector.
Connect your marketing platforms and build a data workflow your entire agency can use.