Starter
For freelancers and small teams.
$ 24 /mo
Billed monthly · cancel anytime
Platforms3
Accounts10
.svg) PostHog query · Power BI format
PostHog query · Power BI format
 PostHog
One source
PostHog
One source
 Saved query
API URL
Power BI
Web · Import
Saved query
API URL
Power BI
Web · Import
Used by the world's leading companies









Available metrics
Available dimensions
PostHog
3 advertising accounts
Connected
 Google Ads
2 advertising accounts
Connected
Google Ads
2 advertising accounts
Connected
 Google Analytics 4
1 web property
Connected
Google Analytics 4
1 web property
Connected
 HubSpot
1 CRM portal
Connected
HubSpot
1 CRM portal
Connected

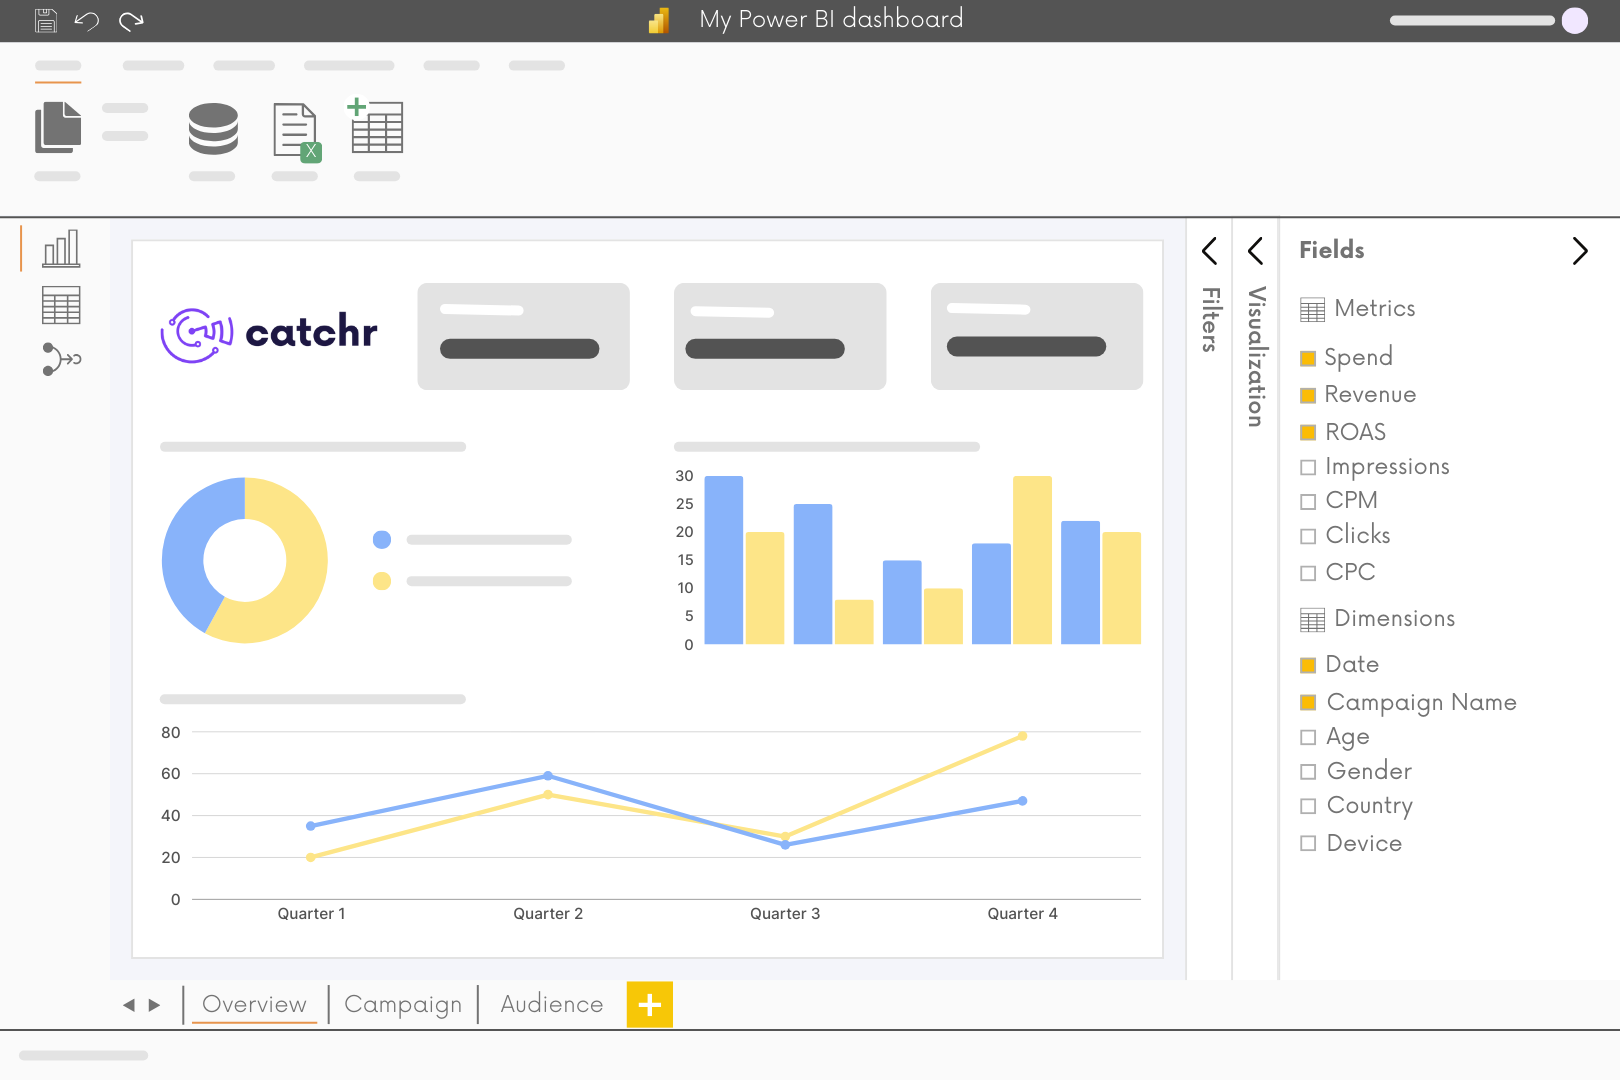
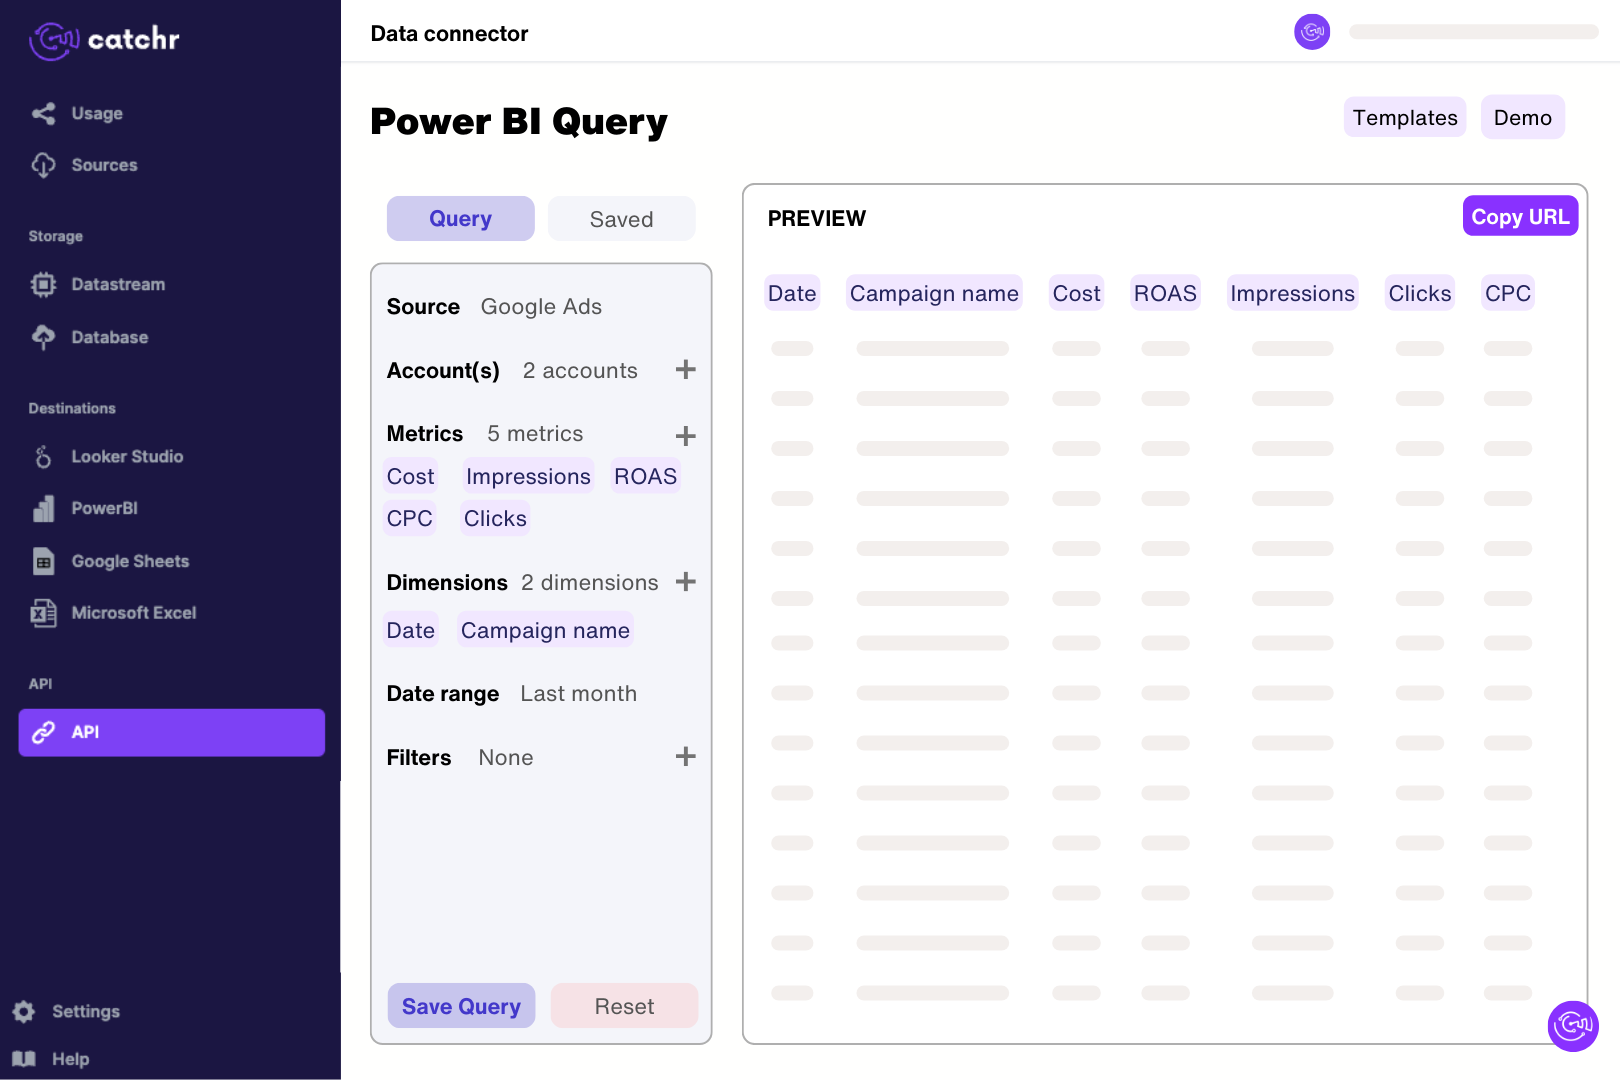
Connect the PostHog project in Catchr and build a Power BI-format query for event names, event times, event IDs and project IDs. Preview a short extraction, copy its URL and use Get data > Web in Power BI Desktop. Set timestamp types in Power Query and keep the event grain before creating measures for activation or feature adoption.
Catchr exposes event names, timestamps, event IDs, distinct IDs, session IDs, page URLs, device information and campaign tags. It also includes event properties as JSON. These fields support event-level reporting; they are not a prebuilt copy of every saved PostHog insight.
Event counts show how often a tracked action occurred. To measure adoption, also count the relevant users and define which population was eligible to use the feature. One power user repeating an action can raise event volume without increasing the number of people adopting it.
Not necessarily. PostHog's identity resolution can associate several identifiers with a person. Counting distinct IDs in exported rows is a different calculation unless the same identity rules are applied. Label the dashboard measure accurately and validate it against a small set of known users.
You can use the event data as an input, but a funnel needs more than a chart of separate event totals. It must link the same users across ordered steps within a defined conversion window. Reproduce those rules in a prepared dataset before expecting the result to match a PostHog funnel.
Yes. Catchr exposes UTM source, medium and campaign alongside event data. Use them where those properties were recorded on the events. A missing campaign value does not prove that a user arrived directly; later product events may not retain the original landing-page tags.
Yes. Add Google Ads to compare campaign investment with product activity. Align campaign identifiers and dates, and define the activation event you want to measure. An aggregate comparison does not automatically establish user-level advertising attribution.
Keep the event identifier, user identifier and timestamp, and define the ordered steps and conversion window before building a funnel visual. Grouping event counts into bars does not enforce a sequence for the same person. Implement those rules in the prepared event table or model, then test known journeys against PostHog. Retain project boundaries when combining multiple projects.
Our team is always here to answer any questions you may have about our data connector.
Connect your marketing platforms and build a data workflow your entire agency can use.





.svg)




























.png)




.svg)