Home > Destinations > Power BI > Pipedrive

Connect Pipedrive to Power BI

Connect Pipedrive to Power BI and and make the most of your data with direct integration into Power BI. Discover how to transfer, analyze, and visualize your marketing data to support better, data-driven decisions.

Pipedrive query · Power BI format
Ready to refresh
Pipedrive One source
Saved query API URL
Power BI Web · Import
Pipedrive accounts One or several selected accounts
Reporting grain Date · campaign · ad set · ad
Fields Selected metrics + dimensions
Date range Last 28 days · example preset
Filters Optional · query-specific
Power BI mode Import through Web (Basic)
One saved URL represents one Catchr source. Multiple Pipedrive accounts can share the query.

Used by the world's leading companies

Get Pipedrive data into Power BI

A no-code connection that works in Power BI Desktop and in the Power BI service.

Connect your data

Launch Pipedrive reporting faster

Skip ODBC drivers and custom API scripts. The connection runs from your browser and Power BI, with nothing else to install on your machine.

Automate extraction

Always work with fresh numbers

Once the report is published, Power BI calls your Facebook Ads query again on the schedule you choose, so weekly reviews start from current figures.

More than just one source

Connect your entire stack. Not only Pipedrive.

Connect not only your Pipedrive account but all your CRM accounts too.

Start with a template

Ready-to-use Power BI dashboards

Move faster with templates built for CRM reporting in Power BI.

Use your Pipedrive data with ready-to-use dashboards for tracking performance, trends, and key indicators.

Pipedrive metrics and dimensions available in Power BI

Access 18 metrics and 118 dimensions from Pipedrive connectors including Person Open Deals Count, Person Won Deals Count, Person Lost Deals Count, Person Activities Count, Person Done Activities Count, Person Email Message Count, Lead Source Name, Lead Title, Lead Amount, Lead Currency, Deal Owner Name, Deal Organization Name, Deal Expected Close Date, Deal Lost Reason and more.

18

Available metrics

118

Available dimensions

How to connect Pipedrive to Power BI ?

Four steps, from Catchr to a refreshed Power BI report.

Step one

Authorize Pipedrive

Connect Pipedrive in Catchr with a Pipedrive user that has access to the CRM accounts you need, and make those accounts available for reporting.

Client A · Connected sources
5 sources ready
Pipedrive 3 advertising accounts Connected
Google Ads 2 advertising accounts Connected
Google Analytics 4 1 web property Connected
HubSpot 1 CRM portal Connected
Step two

Build and preview the query

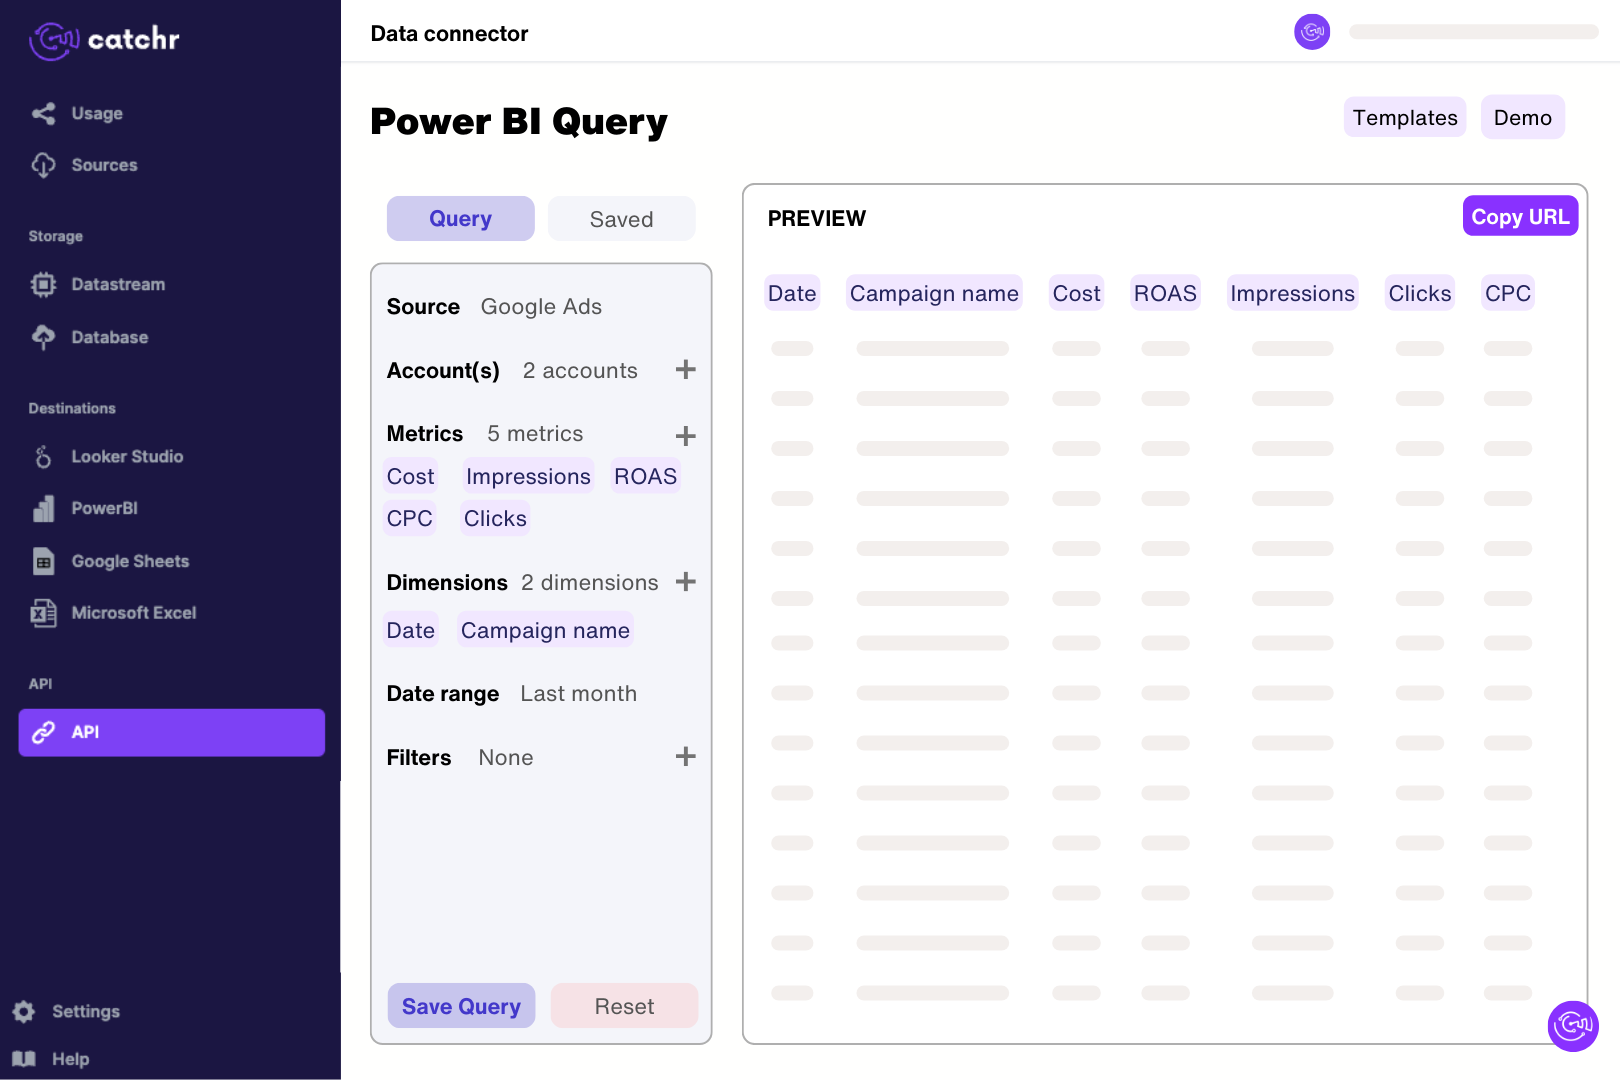
Choose Power BI format, select Pipedrive, accounts, fields, date range, filters, and supported options. Preview the response, save the query, and copy its URL.

Step three

Use Get data > Web

In Power BI Desktop, choose Get data > Web, keep Basic selected, paste the complete Catchr URL, confirm, then load or transform the response.

Step four

Shape, model, and refresh

Clean the table in Power Query, add relationships and DAX measures, then publish the report and set its refresh schedule in the Power BI service.

Pipedrive to Power BIpricing

Choose your plan by the number of platforms and accounts you report on.

Starter

For freelancers and small teams.

$ 24 /mo

Billed monthly · cancel anytime

Platforms3
Accounts10
Start free trial

Growth

For agencies managing more clients.

$ 239 /mo

Billed monthly · cancel anytime

Platforms10
Accounts100
Start free trial

Scale

For teams reporting at scale.

$ 599 /mo

Billed monthly · cancel anytime

Platforms25
Accounts500
Start free trial

More Power BI connectors

Thank you! Your submission has been received!
Oops! Something went wrong while submitting the form.

Pipedrive to Power BI: FAQ

Answers to common questions about connecting data to spreadsheets, dashboards, AI assistants, and reporting tools with Catchr.

How can I connect Pipedrive to Power BI?

Connect the Pipedrive account in Catchr and select the available CRM records. In Catchr’s Power BI query builder, select deal IDs, values, stages and close dates and preview a short extraction. Import the generated URL through Get data > Web in Power BI Desktop. Check the returned rows before building measures, keeping deal IDs and deal currency before summarizing pipeline clear in the model.

Can I track won, lost and open Pipedrive deals separately?

Yes. Use the deal status field to separate open opportunities from won and lost deals. Show deal count and value together: a team can win more deals while generating less value if the average deal size falls. Keep lost deals visible in a dedicated view to investigate the reasons behind them.

Which date should I use for a monthly sales report?

Use the won date for completed wins, the lost date for losses and the added date for newly created opportunities. Expected close date is useful for planning open pipeline. Catchr exposes these dates separately; choosing the wrong one can move a deal into a different reporting month.

Can I analyze why Pipedrive deals are lost?

Yes. Catchr includes the lost reason and lost time fields. Filter to lost deals and group by reason, using both deal count and value. Keep blank reasons visible so you can distinguish an actual pattern from incomplete CRM data.

How can I spot deals that need follow-up?

Use next activity date, last activity date and unfinished activity counts alongside deal status and owner. Build a view of open deals with overdue or missing next steps. An inactive deal is a prompt to investigate, not proof that the opportunity is lost.

What is the difference between deal value and weighted value?

Deal value is the full potential amount. Weighted value reflects the probability assigned to the opportunity. Catchr exposes both, so you can show potential pipeline and a probability-adjusted forecast separately. Neither measure should be presented as collected revenue while the deal remains open.

Can I compare Pipedrive sales with Google Ads campaigns?

Yes. Add Google Ads to compare acquisition spend with leads and won deals. Define campaign mappings and the sales period before creating relationships. Daily spend and daily won revenue can move at different times because deals take time to close.

Still have a question?

Our team is always here to answer any questions you may have about our data connector.

Your next report should not start with five exports

Connect your marketing platforms and build a data workflow your entire agency can use.

14 days free-trial
No credit-card required
100+ sources