Starter
For freelancers and small teams.
$ 24 /mo
Billed monthly · cancel anytime
Platforms3
Accounts10
.svg) Pardot query · Power BI format
Pardot query · Power BI format
 Pardot
One source
Pardot
One source
 Saved query
API URL
Power BI
Web · Import
Saved query
API URL
Power BI
Web · Import
Used by the world's leading companies









Available metrics
Available dimensions
Pardot
3 advertising accounts
Connected
 Google Ads
2 advertising accounts
Connected
Google Ads
2 advertising accounts
Connected
 Google Analytics 4
1 web property
Connected
Google Analytics 4
1 web property
Connected
 HubSpot
1 CRM portal
Connected
HubSpot
1 CRM portal
Connected

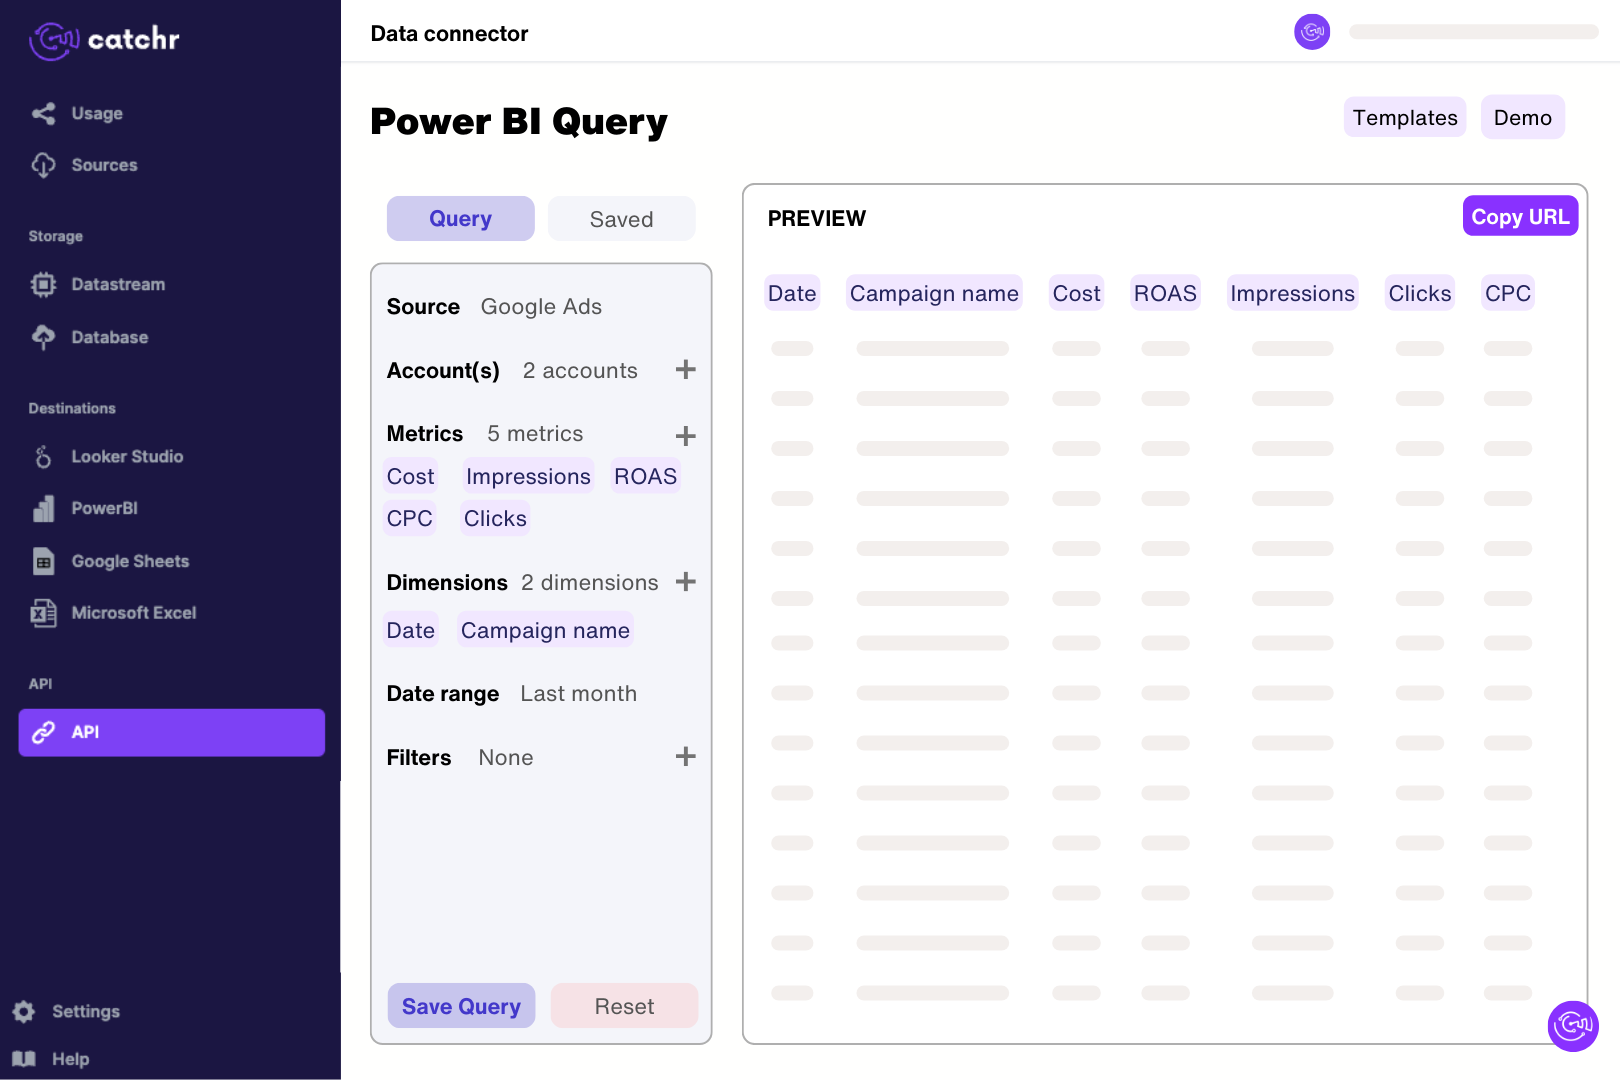
Connect Salesforce Account Engagement in Catchr with the Business Unit ID and a Salesforce user allowed to access it. In Catchr’s Power BI query builder, select the available prospect and campaign reporting fields and preview a short extraction. Import the generated URL through Get data > Web in Power BI Desktop. Check the returned rows before building measures, keeping business unit and the relationship between prospects and repeated activities clear in the model.
Yes. Pardot is the former name of Salesforce Account Engagement, and the Catchr source retains the Pardot name. Choose the relevant Account Engagement business unit when connecting. A Salesforce organization can contain multiple business units, so the business unit selection matters when checking which prospects and activities appear.
Catchr exposes prospects, campaigns, opportunities, visitor activities, and email performance fields. You can examine prospect score and grade, campaign names and costs, opportunity stages and values, and email opens or clicks. These records have different levels of detail; build separate charts or join on suitable identifiers rather than placing every field in one table.
Catchr calculates these email metrics from visitor activities recorded within the selected extraction period. An open this month can relate to an email sent earlier, so the result is not necessarily the lifetime total shown in an email report. Use the same activity window when comparing reports, and include the relevant send and response period when interpreting rates.
Catchr counts distinct prospect IDs for opens and email-tracker clicks within each email and list-email group in the selected period. Repeated activity by the same prospect increases total interactions without increasing that group’s unique count. Summing unique counts across emails or separate periods can count the same prospect more than once.
The connector derives delivered emails from sent activities minus bounce activities in the extraction window. If the period includes late opens or bounces but excludes the original sends, the numerator and denominator may describe different parts of the email lifecycle. Review the underlying sent, bounce, and unique-open counts and widen the period before interpreting the percentage.
Yes. Put Pardot campaign or opportunity reporting alongside Google Ads spend. Use an explicit campaign mapping and consistent dates before creating relationships. An opportunity value can be repeated across related activity rows, so aggregate at the opportunity level first; joining activity to spend does not by itself establish revenue attribution.
Our team is always here to answer any questions you may have about our data connector.
Connect your marketing platforms and build a data workflow your entire agency can use.





.svg)




























.png)




.svg)