Home > Destinations > Power BI > Adform

Connect Adform to Power BI

Connect Adform to Power BI and and make the most of your data with direct integration into Power BI. Discover how to transfer, analyze, and visualize your marketing data to support better, data-driven decisions.

Adform query · Power BI format
Ready to refresh
Adform One source
Saved query API URL
Power BI Web · Import
Adform accounts One or several selected accounts
Reporting grain Date · campaign · ad set · ad
Fields Selected metrics + dimensions
Date range Last 28 days · example preset
Filters Optional · query-specific
Power BI mode Import through Web (Basic)
One saved URL represents one Catchr source. Multiple Adform accounts can share the query.

Used by the world's leading companies

Get Adform data into Power BI

A no-code connection that works in Power BI Desktop and in the Power BI service.

Connect your data

Launch Adform reporting faster

Skip ODBC drivers and custom API scripts. The connection runs from your browser and Power BI, with nothing else to install on your machine.

Automate extraction

Always work with fresh numbers

Once the report is published, Power BI calls your Facebook Ads query again on the schedule you choose, so weekly reviews start from current figures.

More than just one source

One query per source, one model for all your ads

Create a separate Catchr query for Google Ads, TikTok Ads, or GA4, load each table, and relate them in the same Power BI model.

Start with a template

Ready-to-use Power BI dashboards

Move faster with templates built for Advertising reporting in Power BI.

Use your Adform data with ready-to-use dashboards for tracking performance, trends, and key indicators.

Adform metrics and dimensions available in Power BI

Access 166 metrics and 213 dimensions from Adform connectors including Cost, Clicks, CTR (%), Conversions, Sales, ROI (%), Campaign, Client, Banner/Adgroups, Line Item, Media, Device Type and more.

166

Available metrics

213

Available dimensions

How to connect Adform to Power BI ?

Four steps, from Catchr to a refreshed Power BI report.

Step one

Authorize Adform

Connect Adform in Catchr with a Adform user that has access to the Advertising accounts you need, and make those accounts available for reporting.

Client A · Connected sources
5 sources ready
Adform 3 advertising accounts Connected
Google Ads 2 advertising accounts Connected
Google Analytics 4 1 web property Connected
HubSpot 1 CRM portal Connected
Step two

Build and preview the query

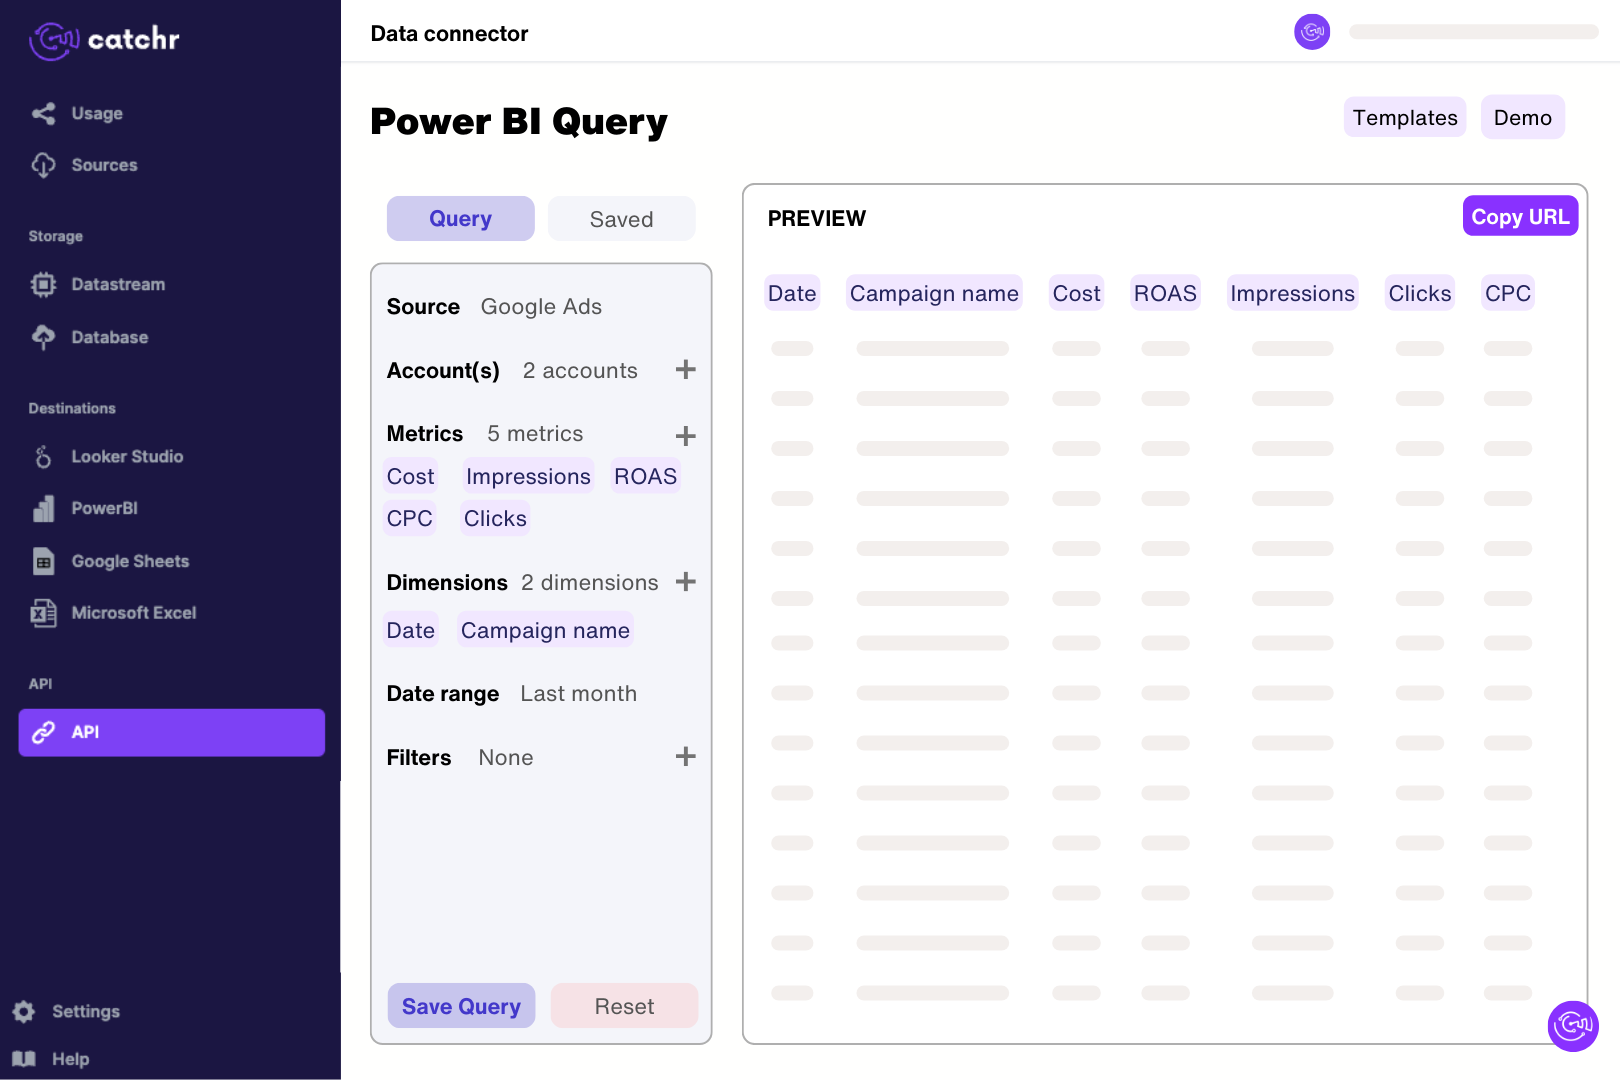
Choose Power BI format, select Adform, accounts, fields, date range, filters, and supported options. Preview the response, save the query, and copy its URL.

Step three

Use Get data > Web

In Power BI Desktop, choose Get data > Web, keep Basic selected, paste the complete Catchr URL, confirm, then load or transform the response.

Step four

Shape, model, and refresh

Clean the table in Power Query, add relationships and DAX measures, then publish the report and set its refresh schedule in the Power BI service.

YOUR NEXT REPORT

What you can build with Facebook Ads data in Power BI

Marketing performanceIllustrative data
Purchase value$38,400
Spend$12,000
ROAS3.20×
Purchase value & spend4 weeks
Week 1
Week 2
Week 3
Week 4
● Purchase value● Spend

ROAS and CPA as DAX measures

Define ROAS as purchase value divided by spend, and CPA as spend divided by purchases, once in the model, so every visual and filter uses the same calculation.

Adform to Power BIpricing

Choose your plan by the number of platforms and accounts you report on.

Starter

For freelancers and small teams.

$ 24 /mo

Billed monthly · cancel anytime

Platforms3
Accounts10
Start free trial

Growth

For agencies managing more clients.

$ 239 /mo

Billed monthly · cancel anytime

Platforms10
Accounts100
Start free trial

Scale

For teams reporting at scale.

$ 599 /mo

Billed monthly · cancel anytime

Platforms25
Accounts500
Start free trial

More Power BI connectors

Thank you! Your submission has been received!
Oops! Something went wrong while submitting the form.

Adform to Power BI: FAQ

Answers to common questions about connecting data to spreadsheets, dashboards, AI assistants, and reporting tools with Catchr.

How do I connect Adform to Power BI?

Authorize Adform in Catchr with a user who can access the advertiser and select the account. In Catchr’s Power BI query builder, select campaign-level Cost and Clicks and preview a short extraction. Import the generated URL through Get data > Web in Power BI Desktop. Check the returned rows before building measures, keeping advertiser, currency and compatible report breakdowns clear in the model.

Which Adform dimensions and metrics are available?

Catchr includes campaign, line item, banner, media, device and geographic reporting fields, together with delivery, cost, site-tracking and viewability metrics. For example, compare Cost and Clicks by Campaign, or inspect banner performance with the appropriate delivery measure. Use combinations supported by Adform reporting and your account access; all fields are not necessarily valid together in one query.

Why does Adform use Tracked Ads instead of Impressions?

Adform renamed its original Impressions measure to Tracked Ads to distinguish it from rendered and viewable impressions. Catchr also exposes Rendered Impressions, Eligible Impressions and viewability metrics. Choose the same measure in both tools when validating a report: an ad being tracked is not equivalent to the ad being rendered or meeting a viewability threshold.

Can I analyze viewability in Power BI?

Yes. The catalog includes viewable, non-viewable and undetermined impressions, plus viewable rates for IAB and custom viewability definitions. Keep the selected definition consistent across charts. A custom threshold can produce a different rate from the IAB measure, and undetermined impressions are not the same as confirmed non-viewable impressions. Use the matching measured-impression basis when calculating your own rate.

Which cost field should I use in my Adform dashboard?

Use the field that matches the question and the cost column in your Adform report. Catchr exposes Cost, RTB Media Cost and several fee or data-cost fields. These may represent different components or totals, so adding every cost field together can double-count charges. Check Campaign Currency as well, and label whether a chart reports media cost or a broader cost measure.

Why do Adform conversions differ from my website analytics?

Match the tracked outcome, campaign filters, reporting dates and attribution rules before comparing totals. Adform exposes different conversion families, including Conversions, Conversions (All) and ID Fusion measures, which should not be treated as interchangeable. Website analytics may credit another interaction or record a different event. Validate tracking and the selected metric before interpreting the difference as lost sales.

Can I combine Adform with other advertising platforms?

Yes. Add sources such as Display & Video 360 or Google Ads to the same report. Align currency, dates and cost definitions. If Adform is also tracking ads bought through another platform, those reports can describe the same delivery, so compare them rather than summing them into a cross-channel total.

Still have a question ? 

Our team is always here to answer any questions you may have about our data connector.

Your next report should not start with five exports.

Connect your marketing platforms and build a data workflow your entire agency can use.

14 days free-trial
No credit-card required
100+ sources