Starter
For freelancers and small teams.
$ 24 /mo
Billed monthly · cancel anytime
Platforms3
Accounts10
.svg) Klaviyo query · Power BI format
Klaviyo query · Power BI format
 Klaviyo
One source
Klaviyo
One source
 Saved query
API URL
Power BI
Web · Import
Saved query
API URL
Power BI
Web · Import









Available metrics
Available dimensions
Klaviyo
3 advertising accounts
Connected
 Google Ads
2 advertising accounts
Connected
Google Ads
2 advertising accounts
Connected
 Google Analytics 4
1 web property
Connected
Google Analytics 4
1 web property
Connected
 HubSpot
1 CRM portal
Connected
HubSpot
1 CRM portal
Connected

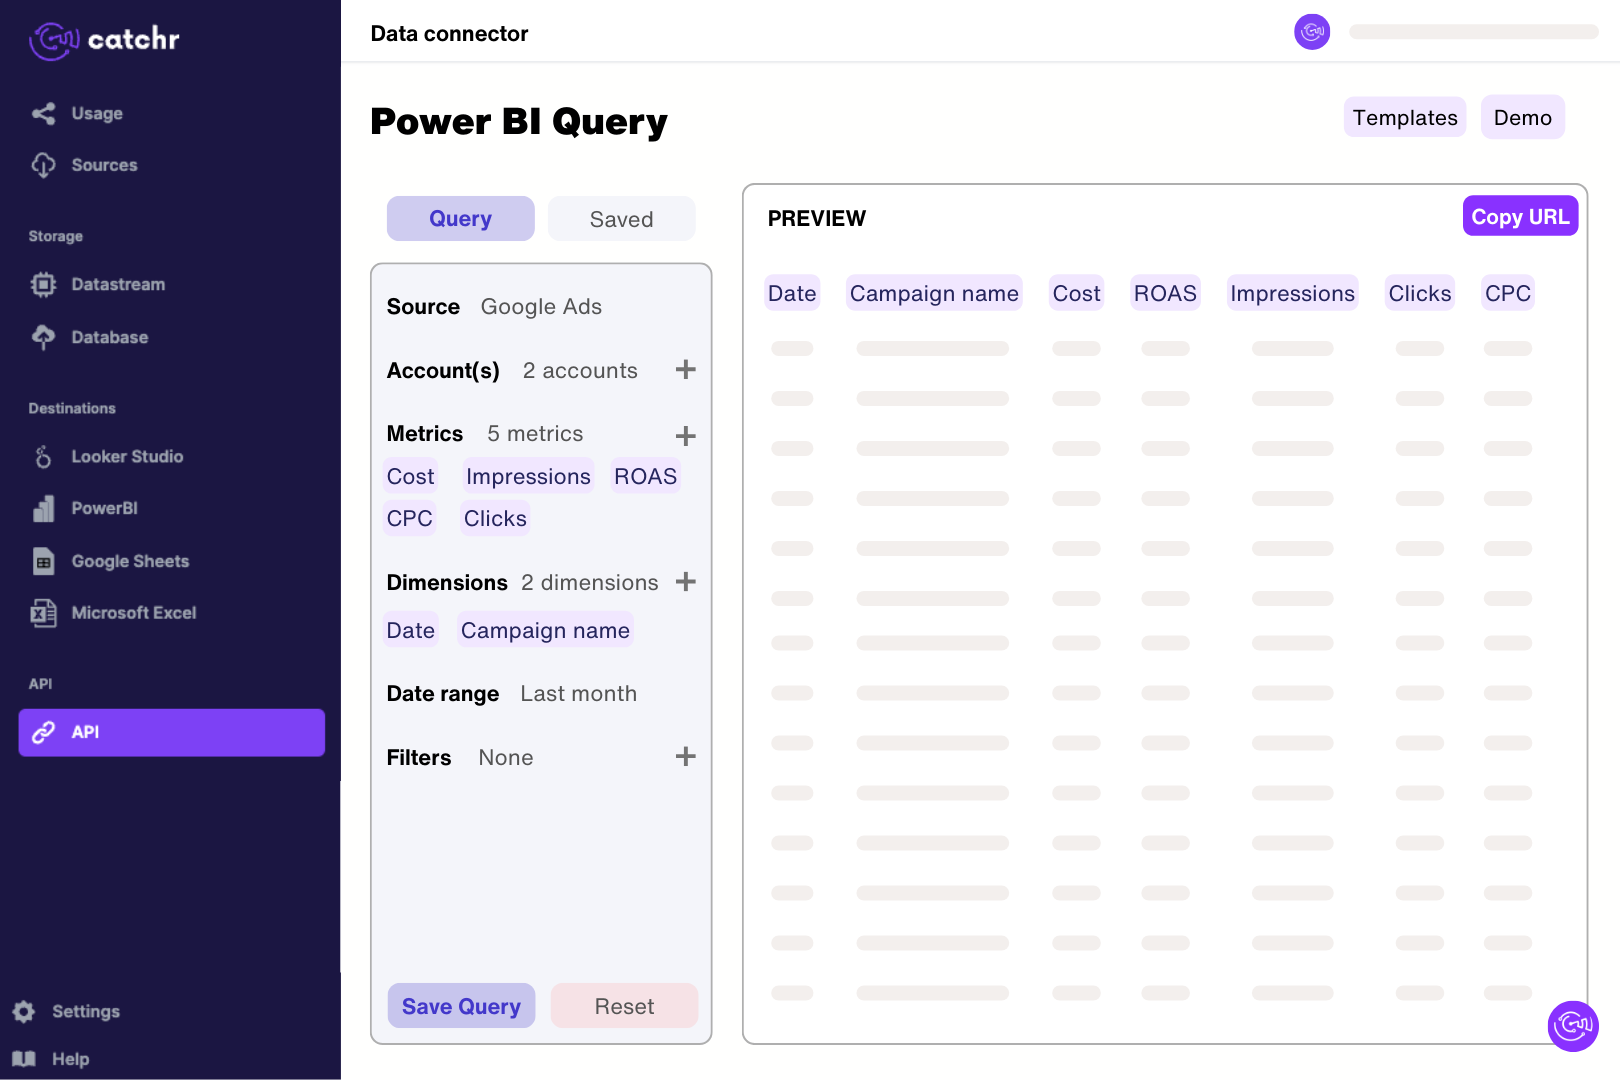
Connect the Klaviyo account in Catchr and select the relevant campaign or flow reporting data. In Catchr’s Power BI query builder, select campaign name and engagement metrics and preview a short extraction. Import the generated URL through Get data > Web in Power BI Desktop. Check the returned rows before building measures, keeping campaign reporting versus recurring flow activity clear in the model.
Yes. Catchr's Klaviyo fields include campaign identifiers and names, flow identifiers and names, and a field indicating whether a campaign is part of a flow. Use those dimensions to separate scheduled campaigns from automated messaging. Compare each group against its own objective rather than ranking every message by raw engagement alone.
Catchr exposes email opens, clicks, unique opens, unique clicks and associated rate fields, together with unsubscribe events. Use the unique metrics to understand how many recipients engaged and total metrics to examine repeat activity. Keep the distinction in chart titles so a stakeholder does not mistake repeated clicks for additional people.
Apple Mail Privacy Protection can generate opens that do not represent someone reading the message. Check the treatment of privacy opens in the Klaviyo report you are comparing. Use clicks and business outcomes alongside opens; a higher open rate by itself is not proof that the campaign persuaded more customers.
Yes. Catchr's Klaviyo fields include campaign channel, SMS clicks and SMS unsubscribe events. Keep email and SMS in separate chart series and use channel-appropriate metrics. An email open rate is not a meaningful metric for SMS, and the same raw click count can represent very different audience sizes.
Klaviyo message attribution assigns conversions to qualifying interactions within an attribution window. Your store reports transactions regardless of whether a message receives credit. Compare the same conversion event, dates and attribution settings, and do not treat message-attributed revenue as an independent set of sales to add on top of store revenue.
Yes. Add Shopify to compare messaging engagement with store performance. Keep store sales and Klaviyo-attributed outcomes clearly labeled. For a trend view, align dates and currencies; linking individual orders to messages requires suitable shared identifiers, not just matching daily totals.
Use matching counts and denominators across the campaigns, rather than averaging the displayed percentages. Decide whether you are measuring unique clickers or all clicks and whether the denominator is sent or delivered messages. Keep that definition consistent with the Klaviyo metric used for comparison.
Our team is always here to answer any questions you may have about our data connector.
Connect your marketing platforms and build a data workflow your entire agency can use.





.svg)




























.png)




.svg)