
Starter
For freelancers and small teams.
$ 24 /mo
Billed monthly · cancel anytime
Platforms3
Accounts10











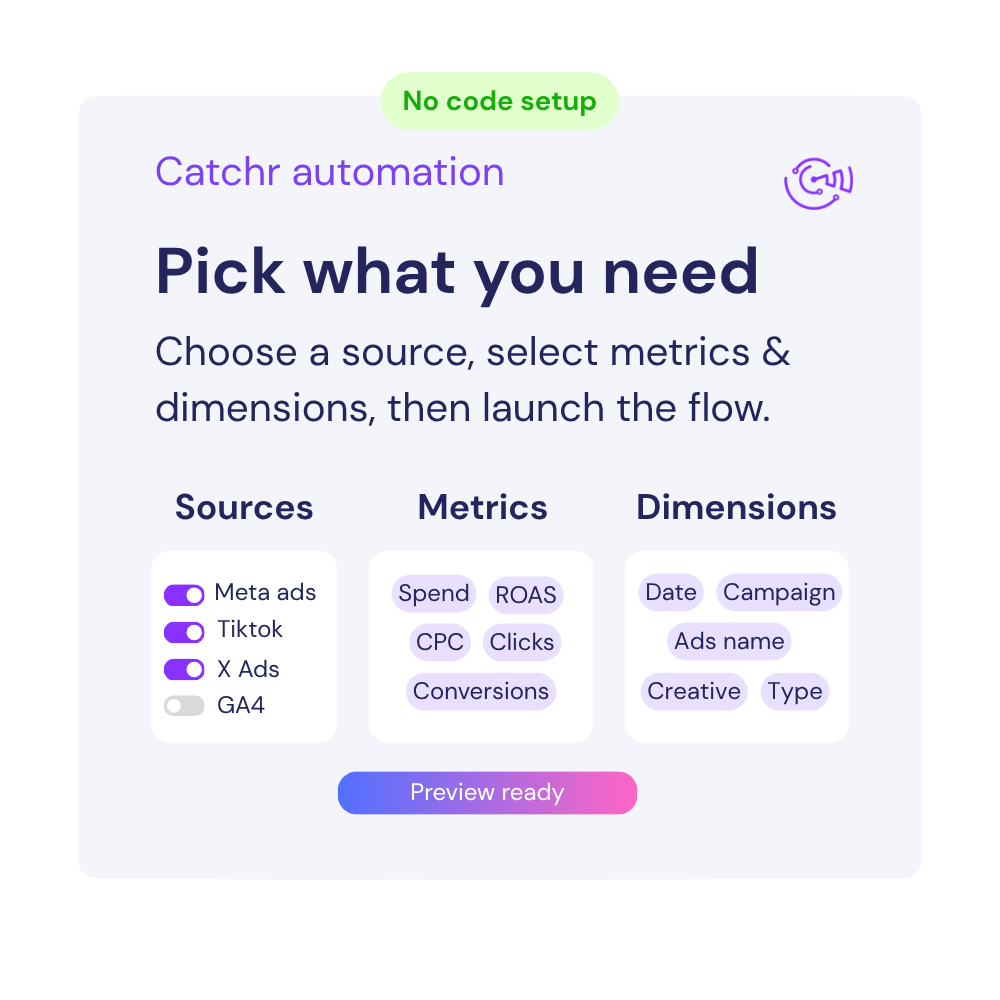
Available metrics
Available dimensions


What our customers say about us.
After three years of use, Catchr has become essential for both our teams and our clients. So far, it has been our best solution for compiling and analyzing data from different advertising platforms. It’s easy to set up, and the customer service is responsive and excellent.

With Catchr’s automated API, we can finally collect and centralize all advertising data, connect it with booking information, and calculate the real ROAS for our restaurant clients. It gives them full visibility, more autonomy, and the ability to optimize campaigns to maximize ROI.

The solution is a real game changer, providing optimal time savings for our data reporting. The major strength of the solution is their highly responsive and professional support.

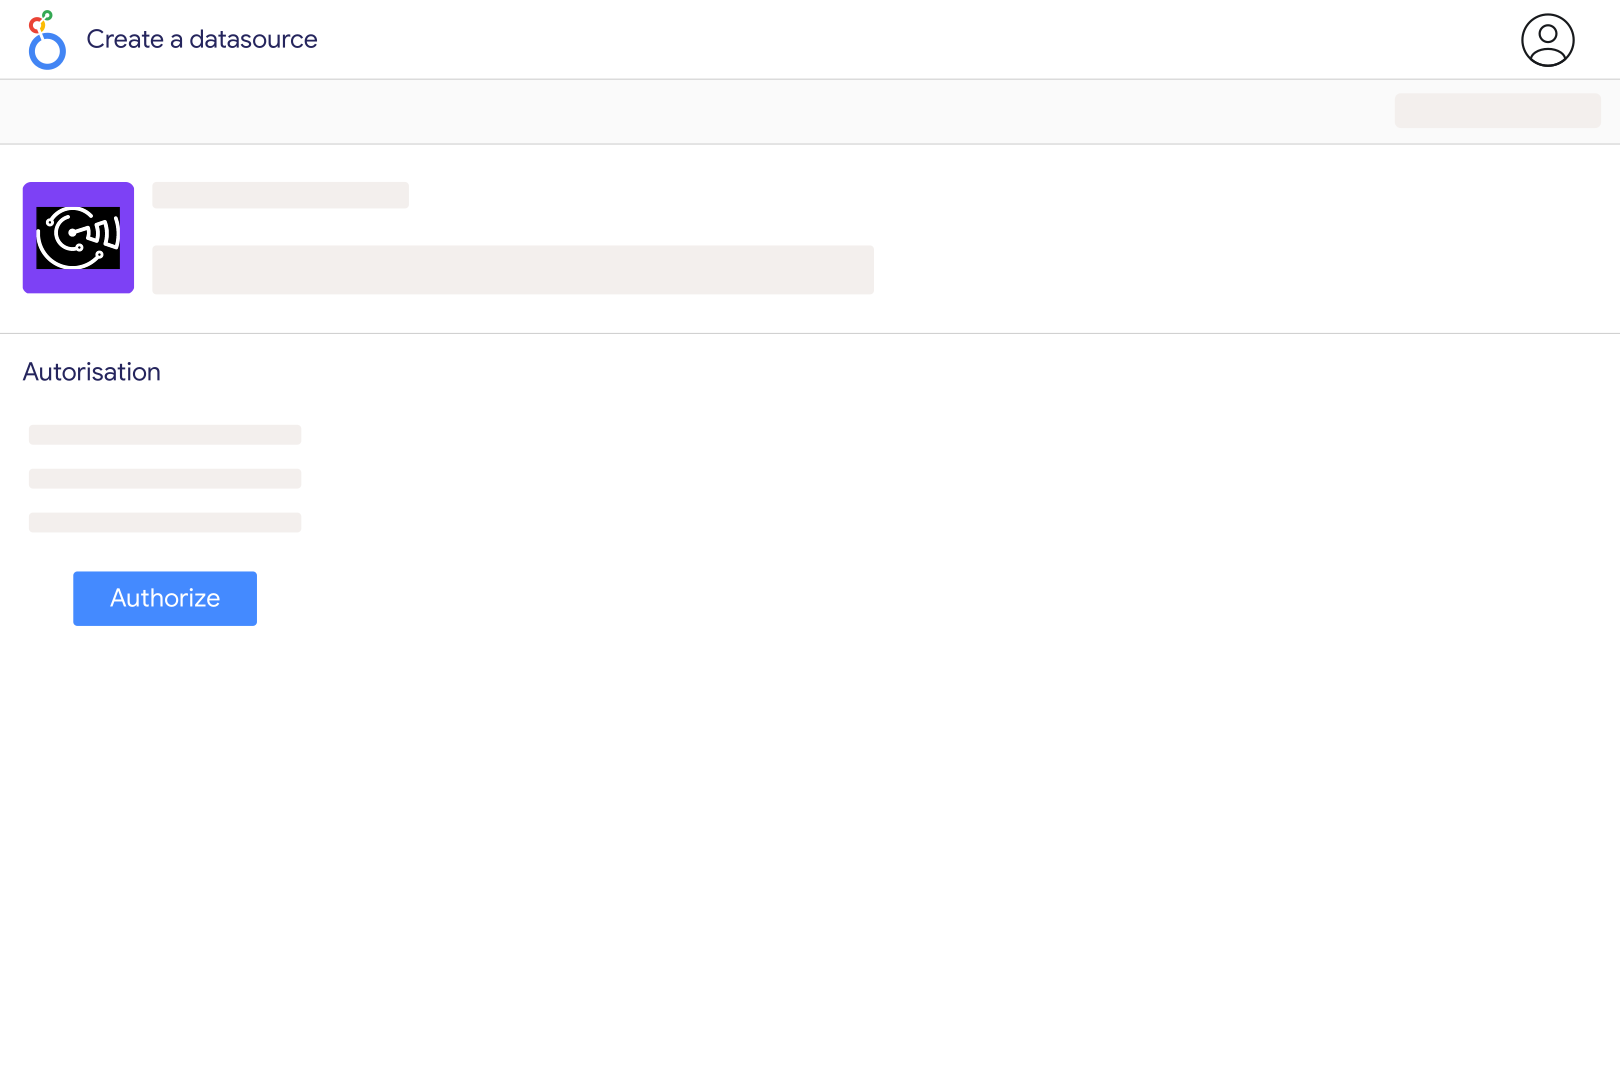
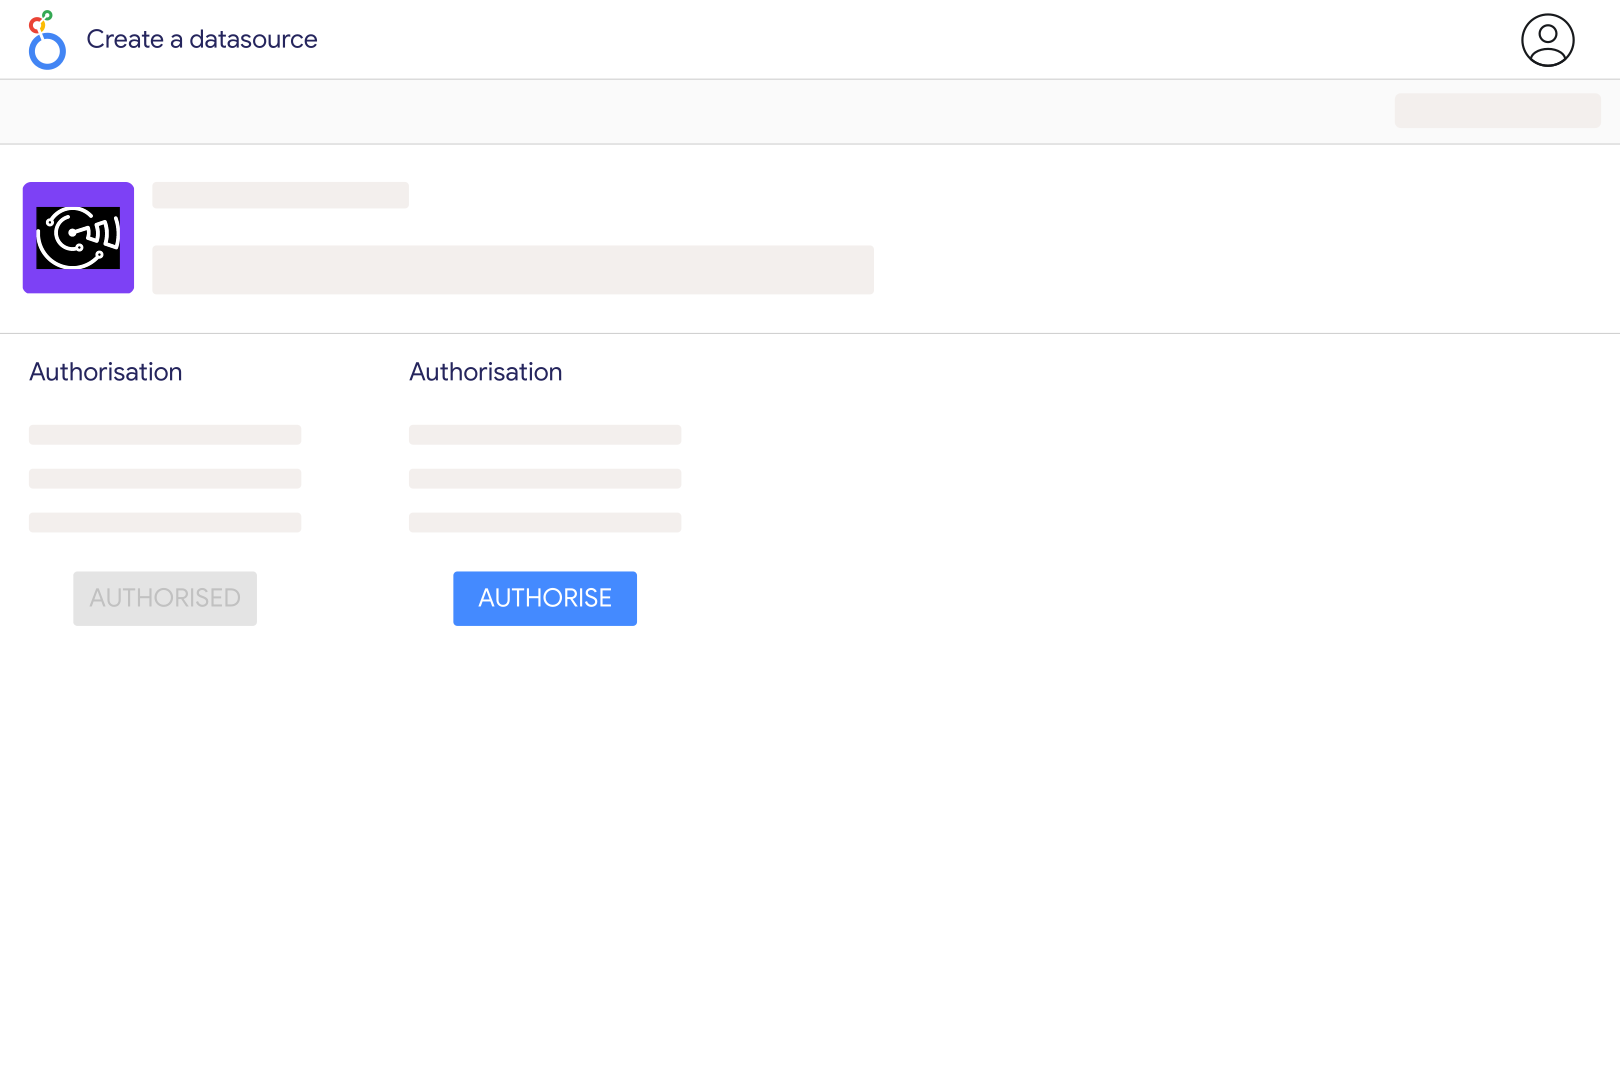
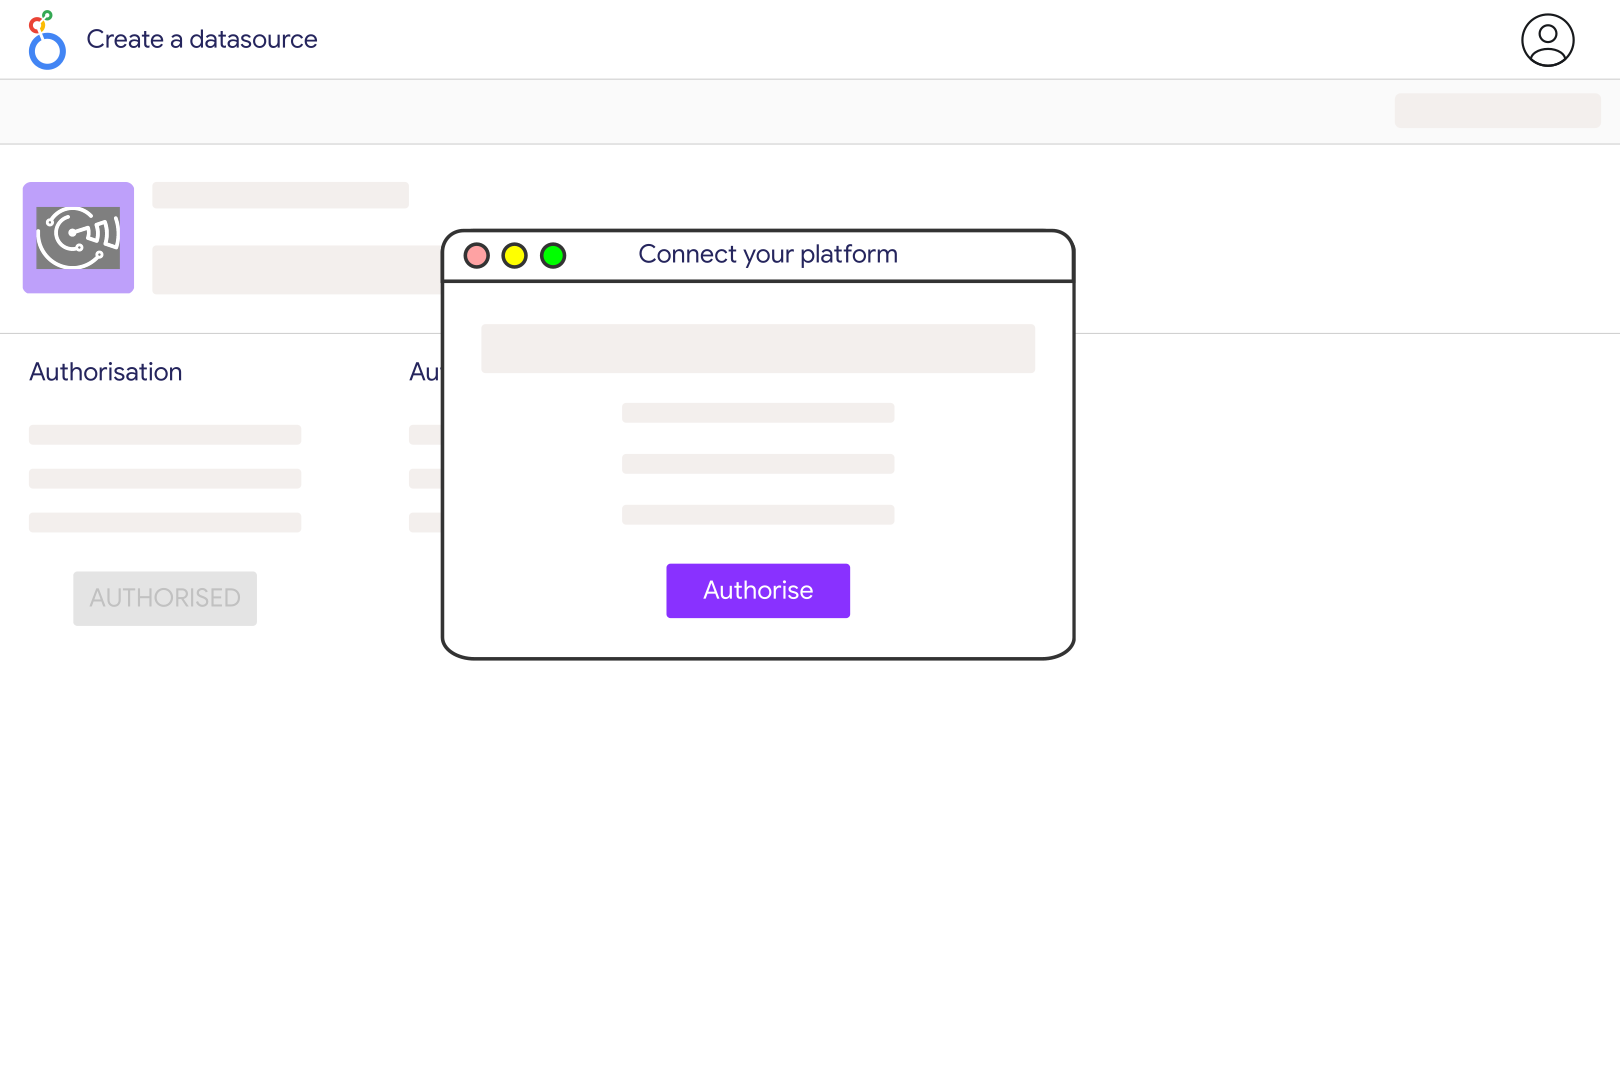
Connect DV360 to Catchr using a Google account with access to the advertisers you want to report on. Open the Catchr Display & Video 360 connector in Looker Studio, authorize Google, and select your source. Begin with advertiser, insertion order, line item, impressions, clicks, and the cost metric that matches your reporting needs.
Yes. Google provides a native connector that connects a data source to one DV360 partner and can include several advertisers under that partner. Catchr provides another connection option alongside its other marketing sources. Choose based on the fields and reporting workflow you need; a partner connector is not the only way to access DV360 data.
Catchr exposes advertiser, insertion-order, line-item, and creative dimensions, along with performance metrics. Use IDs to distinguish similarly named objects and select compatible dimensions for each report. Adding extra breakdowns changes the level of detail, so confirm that totals remain consistent before joining the data to another source.
The catalog includes media-cost and total-media-cost fields, as well as cost fields expressed in different currencies. Choose the cost definition used in the DV360 report you are comparing and keep that definition consistent throughout the dashboard. Do not add different cost measures together or mix advertiser currencies in an unconverted total.
Keep eligible, measurable, and viewable impressions separate. The standard Active View viewable rate uses viewable impressions divided by measurable impressions, rather than all served impressions. A completed video is a different event from a viewable impression. Use the matching numerator and denominator instead of averaging the percentages from individual rows.
Compare the conversion activity, attribution model, click or view basis, date range, and reporting time zone first. DV360 exposes several conversion and revenue measures, including cross-environment variants, which are not interchangeable. Recent results may also change while conversions are attributed. Match definitions before treating a difference as a connector error.
Yes. Add Google Ads to compare spending and performance across buying platforms. Align currencies, dates, and cost definitions before blending. Conversions attributed independently by each platform can overlap, so adding them does not establish a deduplicated total of customers or sales.
Our team is always here to answer any questions you may have about our data connector.









