Home > Destinations > Data Studio (ex Looker Studio) > Google Ads

Connect Google Ads to Data Studio (ex Looker Studio)

Connect Google Ads to Data Studio (ex Looker Studio) and and build automated dashboards without CSV exports, spreadsheets, or manual API setup.

Looker Studio
Power BI
Google Sheets
BigQuery
Snowflake

Used by the world's leading companies

Why do agencies use Catchr for Google Ads reporting in Data Studio (Looker Studio)?

Catchr lets media buyers and agencies stop rebuilding Google Ads reports by hand: the data lands in Data Studio ready to chart, for every ad account you manage.

No manual csv export
‍

Stop downloading files from Google Ads every time a client report, spreadsheet, or dashboard needs fresh numbers.

Connected in minutes

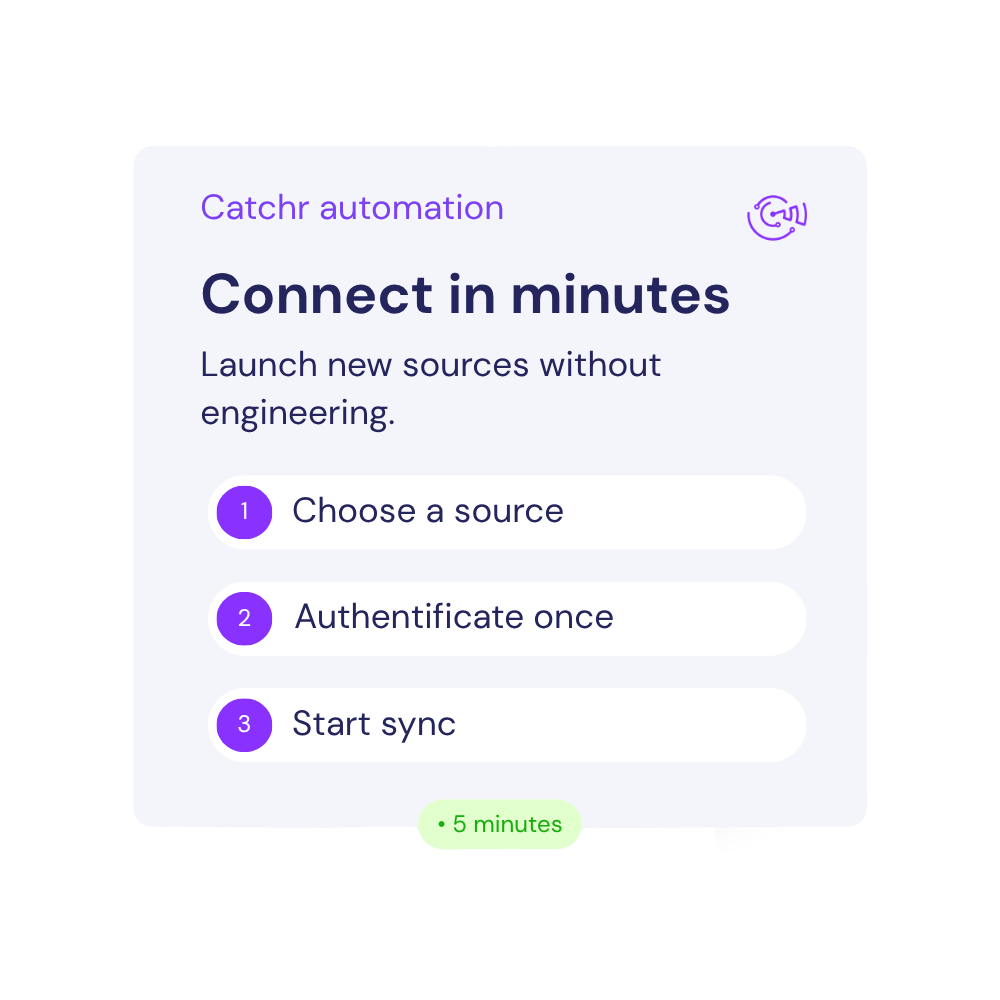
Your first Google Ads report can be live in a few minutes. Authorize your Google Ads account, pick your ad accounts, and your data source is ready.

Built for agencies with many Advertising accounts

Pull several Advertising accounts into one data source, then filter by account to build a report per client or brand in the same Data Studio file.

Google Ads to Looker Studio pricing

Choose your plan by the number of platforms and accounts you report on.

Starter

For freelancers and small teams.

$ 24 /mo

Billed monthly · cancel anytime

Platforms3
Accounts10
Start free trial

Growth

For agencies managing more clients.

$ 239 /mo

Billed monthly · cancel anytime

Platforms10
Accounts100
Start free trial

Scale

For teams reporting at scale.

$ 599 /mo

Billed monthly · cancel anytime

Platforms25
Accounts500
Start free trial

How to connect Google Ads to Data Studio with Catchr?

To connect Google Ads to Looker Studio (Data Studio), open the Catchr connector, authorize your Google Ads account, select the ad accounts you want to report on, then create your report.

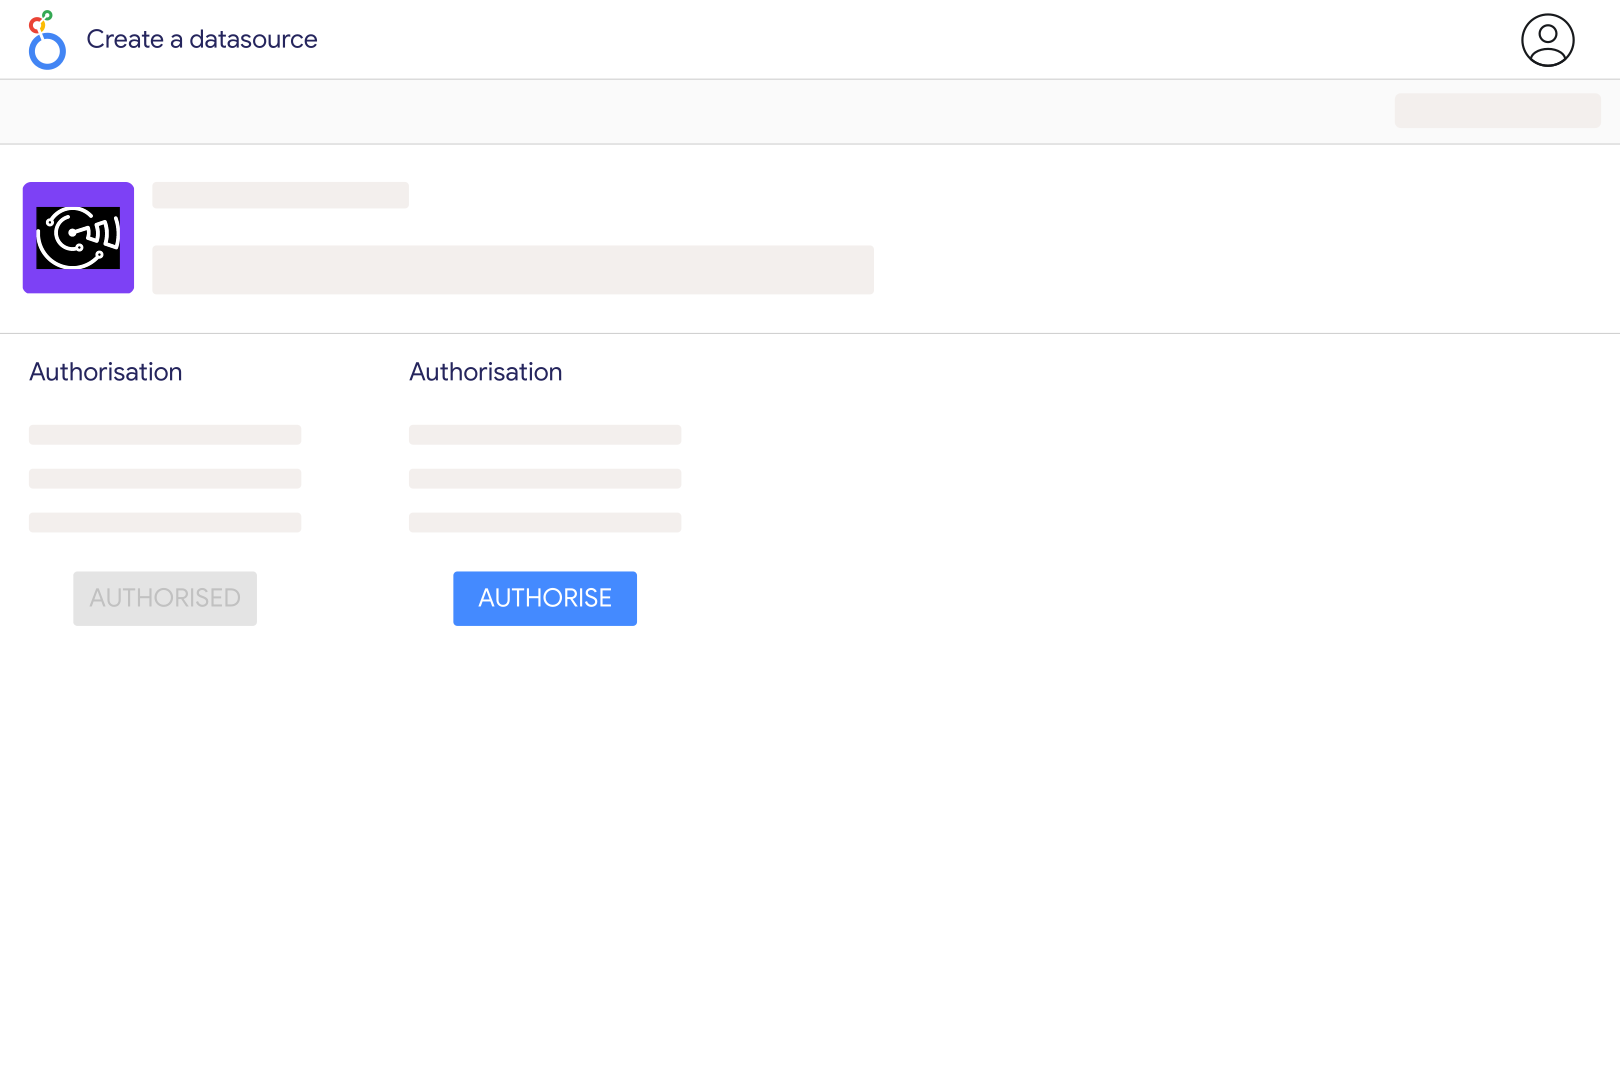
1. Open the Catchr Google Ads connector in Looker Studio

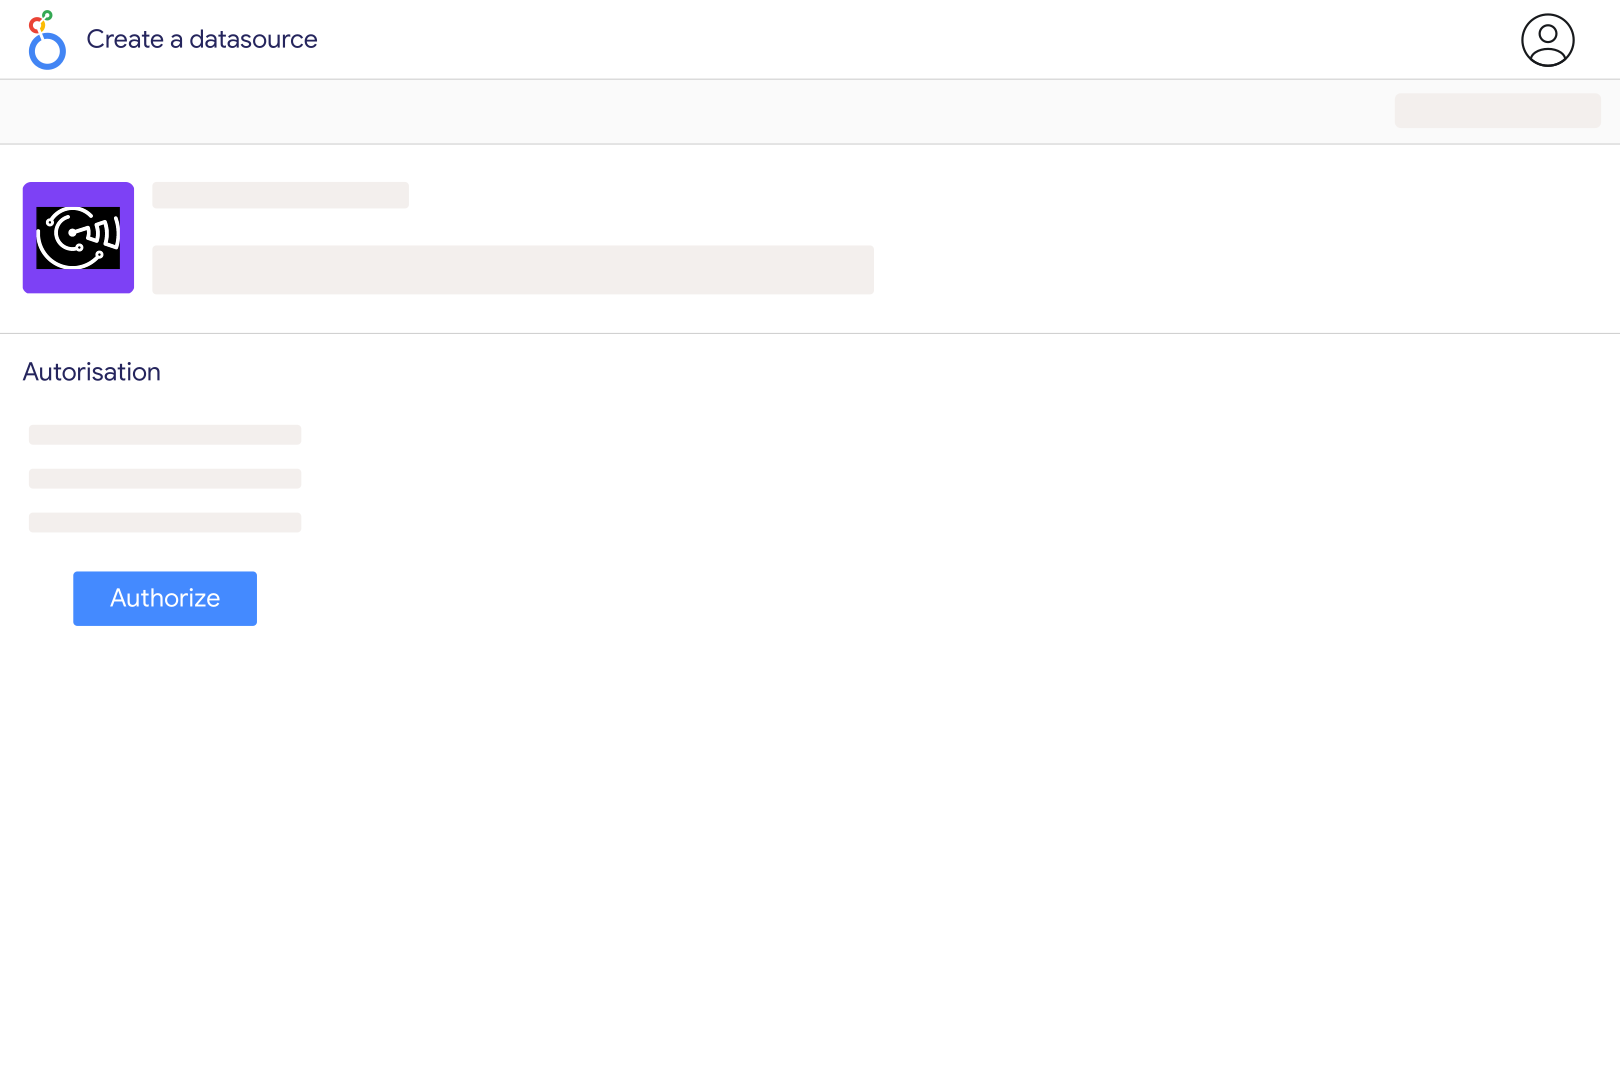
Click the connector link to open it inside Looker Studio. You will be asked to authorize the connector before creating your data source.

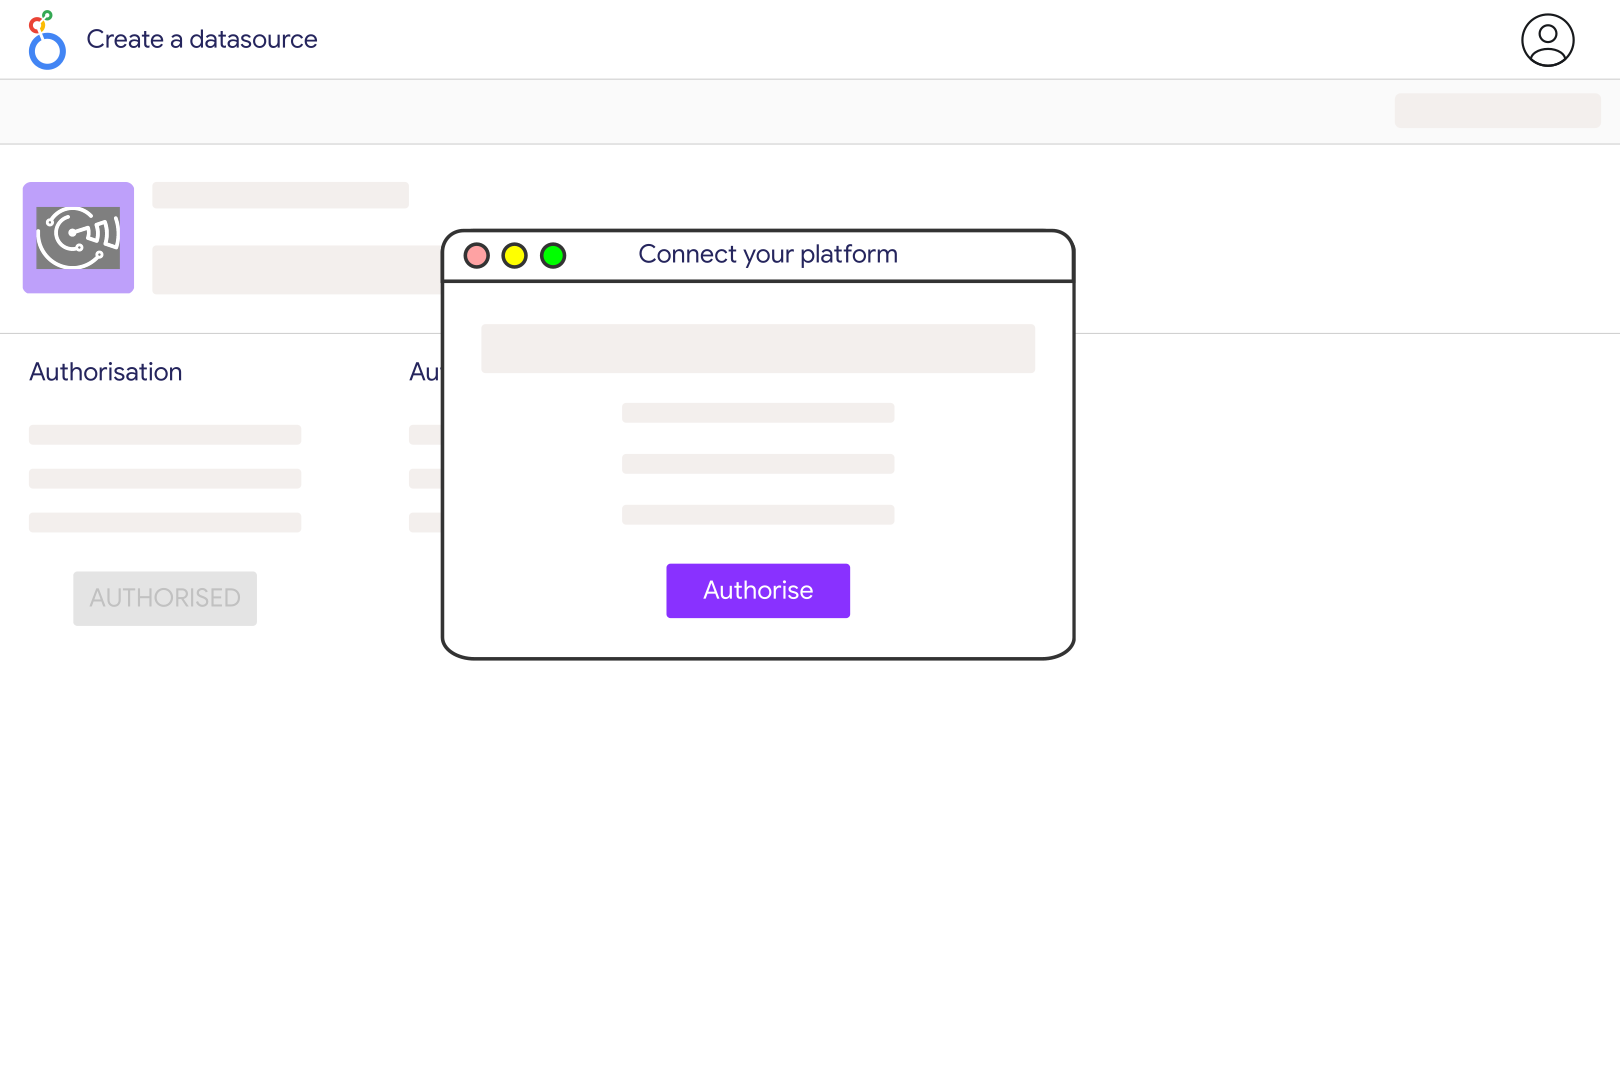
2. Authorize Looker Studio (Data Studio) and Catchr

Choose the Google account you use for Looker Studio and authorize Catchr to create a secure Google Ads data source.

3. Connect your Google Ads account

Sign in with your Google Ads account that has access to the accounts you want to report on. Make sure your user has the right Google Ads permissions.

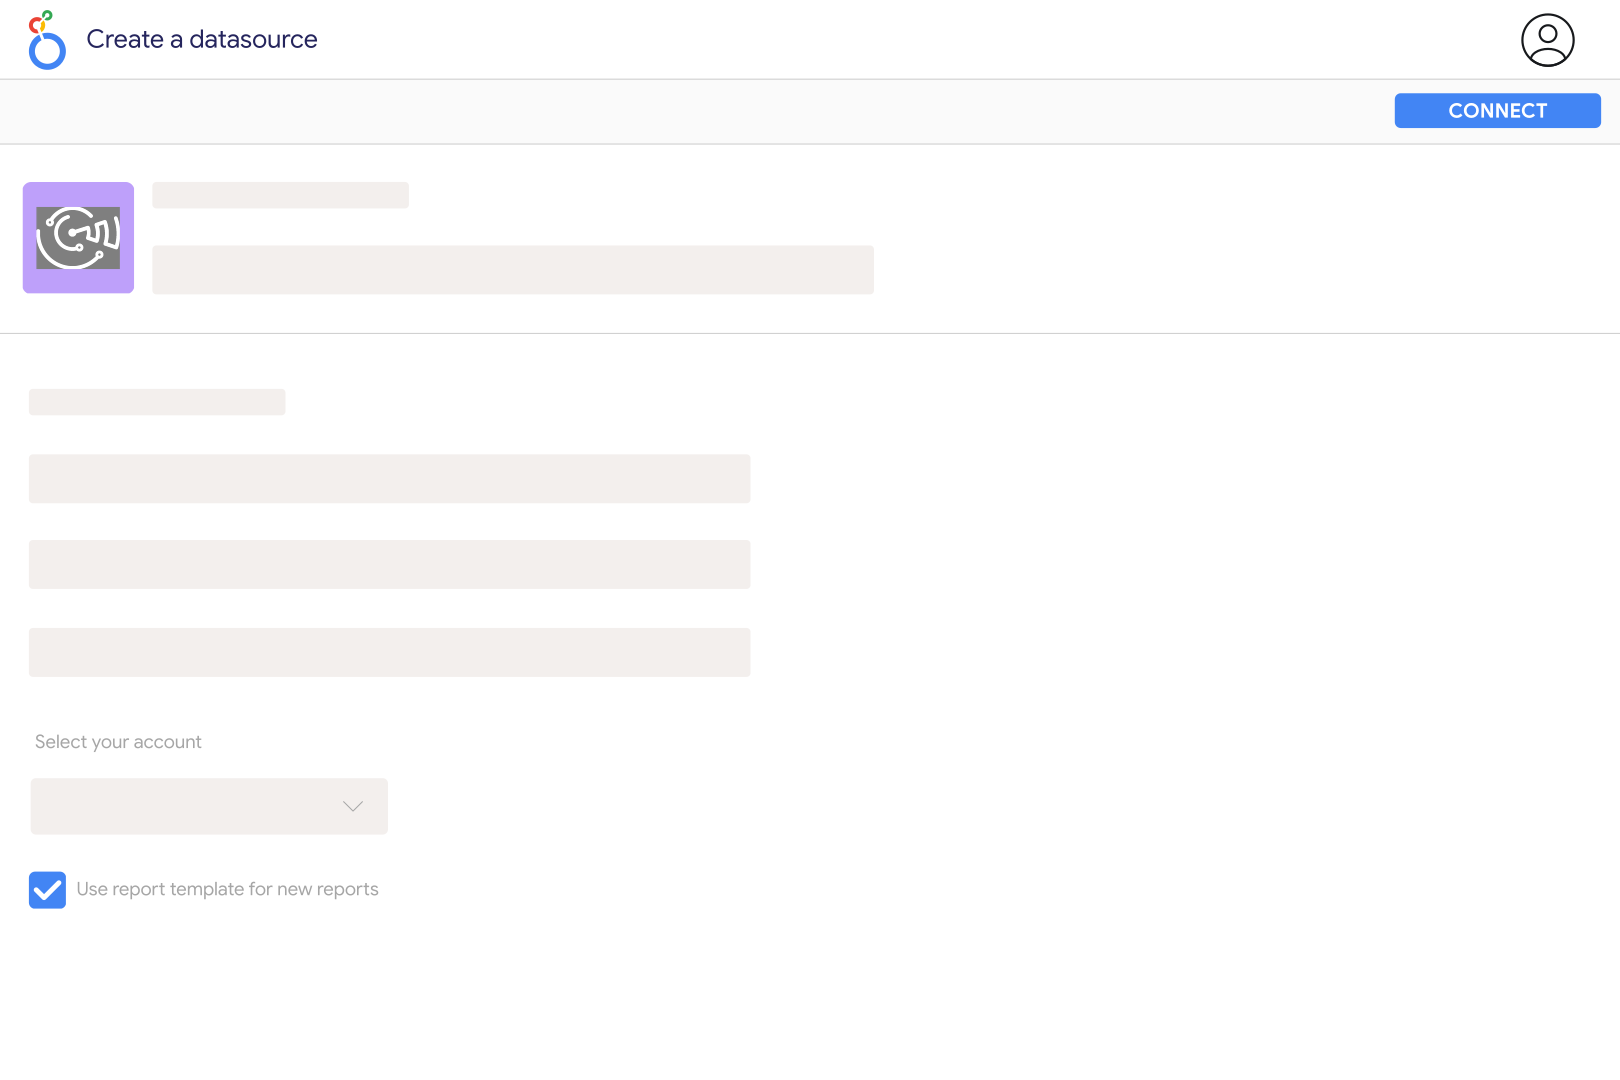
4. Select your Google Ads accounts

Choose one or several Advertising accounts, depending on the report you want to build.

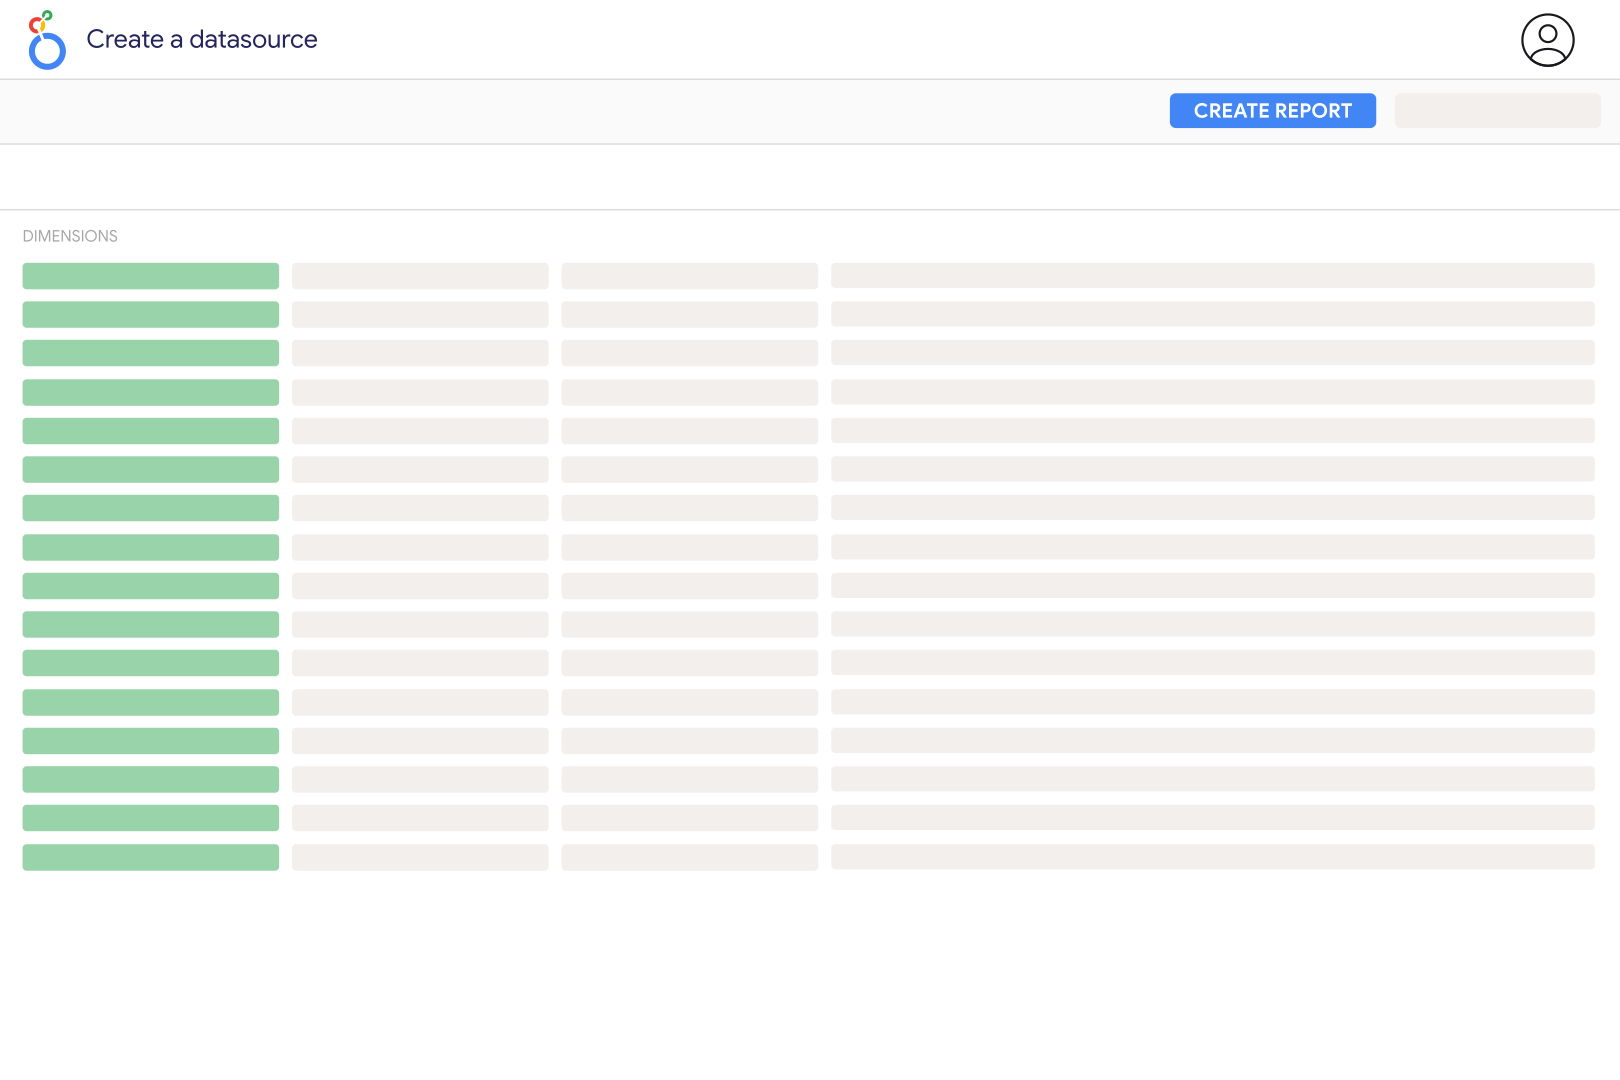
5. Create your Data Studio report

Click Create report, then add charts, scorecards, tables, filters, and date controls using your Google Ads metrics and dimensions.

6. Customize your dashboard

Use Cost, Clicks, Impressions, Conversions, Conv. rate, CTR, Avg. CPC, ROAS, Campaign Name, Campaign state, Ad group, Ad group state, Advertising Channel, Keyword Match Query, Query Match type, Country Code and many more.

Google Ads metrics and dimensions available in Data Studio

Access 118 metrics and 409 dimensions from Google Ads connectors including Cost, Clicks, Impressions, Conversions, Conv. rate, CTR, Avg. CPC, ROAS, Campaign Name, Campaign state, Ad group, Ad group state, Advertising Channel, Keyword Match Query, Query Match type, Country Code and more.

118

Available metrics

409

Available dimensions

Build better Google Ads dashboards in Data Studio (ex Looker Studio)

Use Catchr to create dashboards that show what is working, what is wasting budget, and where performance is changing.

Client reporting for agencies

Create clean Looker Studio dashboards for each client with with Cost, Clicks, Impressions, Conversions, Conv. rate, CTR, Avg. CPC, ROAS always up to date.

Budget pacing

Compare daily spend with the monthly budget of each campaign, so overspend shows up mid-month instead of on the invoice.

Review what drives results across

Compare to see where budget, traffic, or revenue is improving and where performance is dropping.

Compare with your other channels

Combine with your others marketing to understand performance across your full acquisition journey.

Keep an eye on Google Ads performance

Track Google Ads Cost, Clicks, Impressions, Conversions, Conv. rate, CTR, Avg. CPC, ROAS in refreshable Data Studio dashboards so you can spot changes before they become reporting problems.

Customer testimonials

What our customers say about us.

85 %
Faster
Reporting time

After three years of use, Catchr has become essential for both our teams and our clients. So far, it has been our best solution for compiling and analyzing data from different advertising platforms. It’s easy to set up, and the customer service is responsive and excellent.

Valentin Keravel
CEO, Laio – Agency

With Catchr’s automated API, we can finally collect and centralize all advertising data, connect it with booking information, and calculate the real ROAS for our restaurant clients. It gives them full visibility, more autonomy, and the ability to optimize campaigns to maximize ROI.

Corentin Largeron
Freelance
30
hours saved

The solution is a real game changer, providing optimal time savings for our data reporting. The major strength of the solution is their highly responsive and professional support.

Corentin Largeron
CEO at The Browz – Agency

Google Ads to Data Studio (ex Looker Studio): FAQ

Answers to common questions about connecting data to spreadsheets, dashboards, AI assistants, and reporting tools with Catchr.

How do I connect Google Ads to Looker Studio with Catchr?

Connect your Google Ads account in Catchr using a Google login with access to the advertising accounts. Open the Catchr Google Ads connector in Looker Studio, select the accounts and create your report. Build a campaign table and a spend trend first, then add the conversion metrics that match your client's goals.

Is there a free Google Ads connector for Looker Studio?

Yes. Google offers its own native Google Ads connector. Catchr is an alternative for teams that want to manage Google Ads and other marketing sources through the same service. Compare the required fields and account workflow before choosing; a paid connector is not required for a basic Google Ads report.

Can I report on several Google Ads accounts in one dashboard?

Yes. Connect the accounts you manage and keep an account identifier in the report so you can filter by client. Check currencies before combining spend or revenue. A total that adds dollars and euros without conversion is not a useful agency-level budget figure.

Why do conversions change after I send a client report?

A customer can convert after the ad interaction, and Google needs time to process the result. Previously reported dates can gain conversions as attribution catches up. Label recent periods as provisional and compare mature periods when assessing cost per conversion or return on ad spend.

Why do Google Ads and GA4 show different conversion numbers?

First check that both reports use the same conversion action or event, date range and attribution rules. Also distinguish reporting by ad-interaction date from reporting by conversion date. A Google Ads conversion count and a GA4 event count are not interchangeable measures of the same customer journey.

How should I calculate CTR, CPC and ROAS across campaigns?

Calculate ratios from the combined inputs: total clicks divided by total impressions for CTR, total cost divided by total clicks for CPC, and total conversion value divided by total cost for ROAS. Avoid taking a simple average of campaign ratios, which gives a tiny campaign the same weight as a large one. Handle zero denominators explicitly.

Can I compare Google Ads with Facebook Ads in Looker Studio?

Yes. Add Facebook Ads to the same report and compare spend, clicks and results by channel. Align currencies and dates, and label each platform's attribution settings. Do not add platform-attributed conversions together and present the result as a deduplicated count of customers.

Will today's Google Ads report contain final results?

No. Different metrics have different processing delays, and conversions can arrive after clicks and impressions. Use today's data for a provisional view of activity, then revisit it after processing and attribution have progressed. Looker Studio caching can introduce a further delay between an update in Google Ads and a refreshed chart.

Still have a question?

Our team is always here to answer any questions you may have about our data connector.