
Starter
For freelancers and small teams.
$ 24 /mo
Billed monthly · cancel anytime
Platforms3
Accounts10









Available metrics
Available dimensions


What our customers say about us.
After three years of use, Catchr has become essential for both our teams and our clients. So far, it has been our best solution for compiling and analyzing data from different advertising platforms. It’s easy to set up, and the customer service is responsive and excellent.

With Catchr’s automated API, we can finally collect and centralize all advertising data, connect it with booking information, and calculate the real ROAS for our restaurant clients. It gives them full visibility, more autonomy, and the ability to optimize campaigns to maximize ROI.

The solution is a real game changer, providing optimal time savings for our data reporting. The major strength of the solution is their highly responsive and professional support.

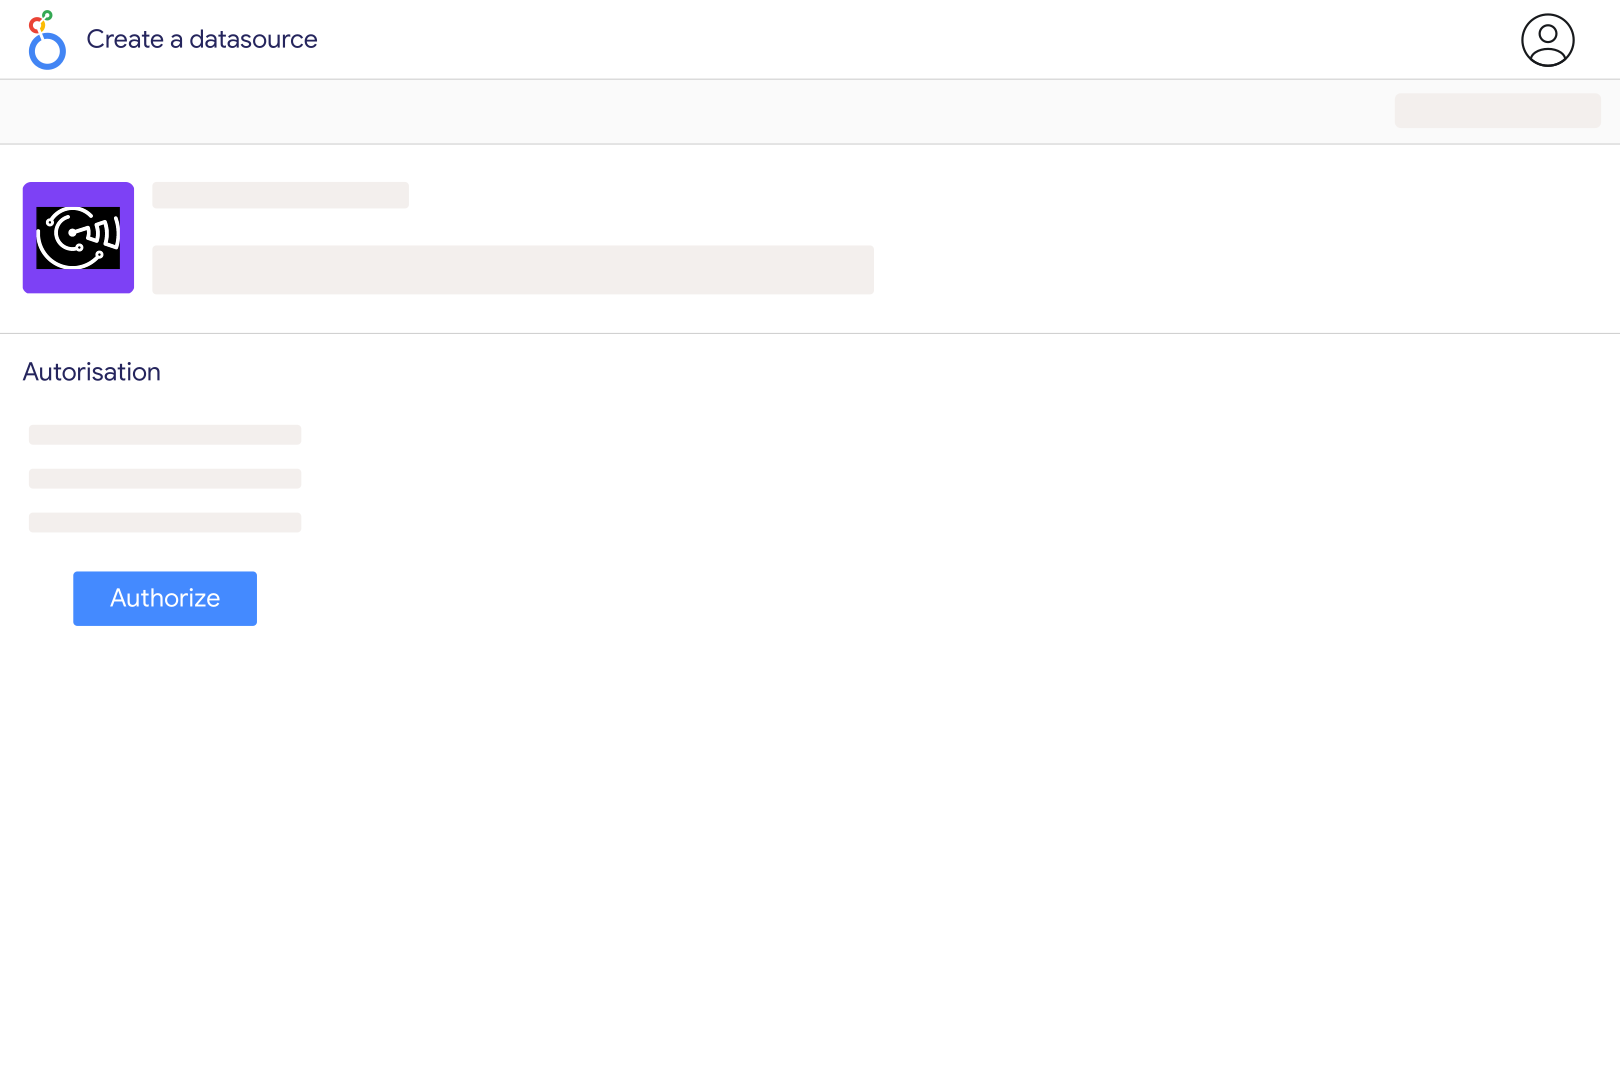
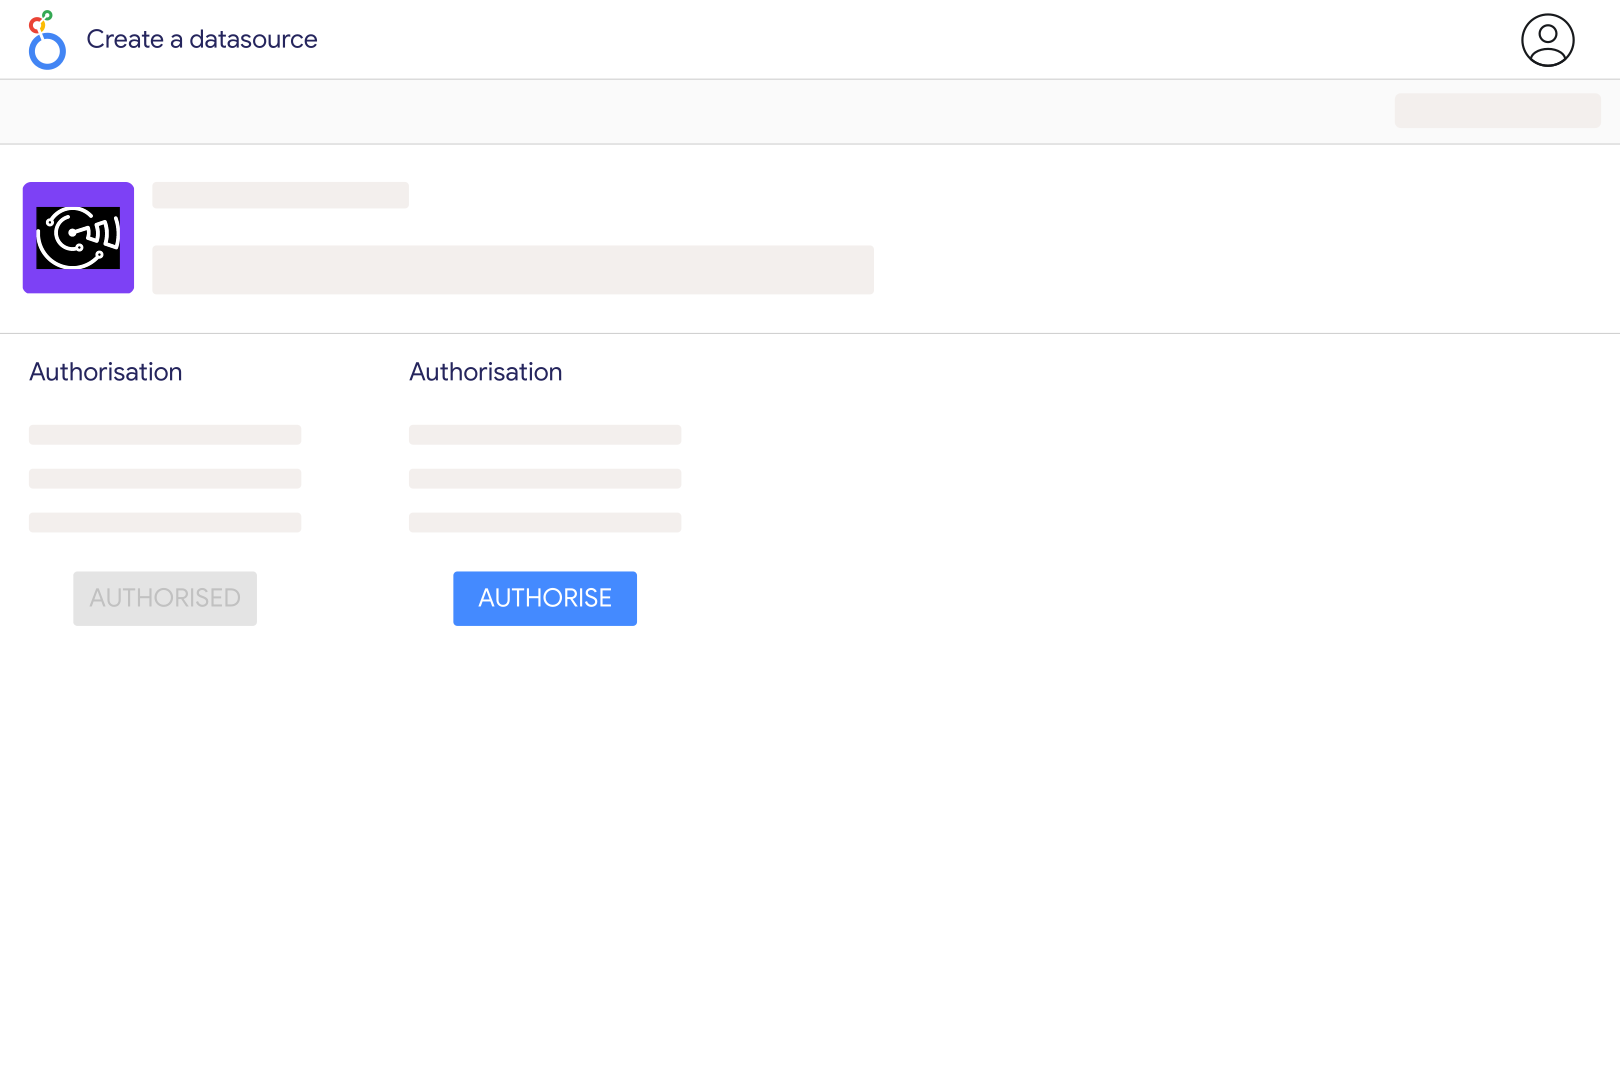
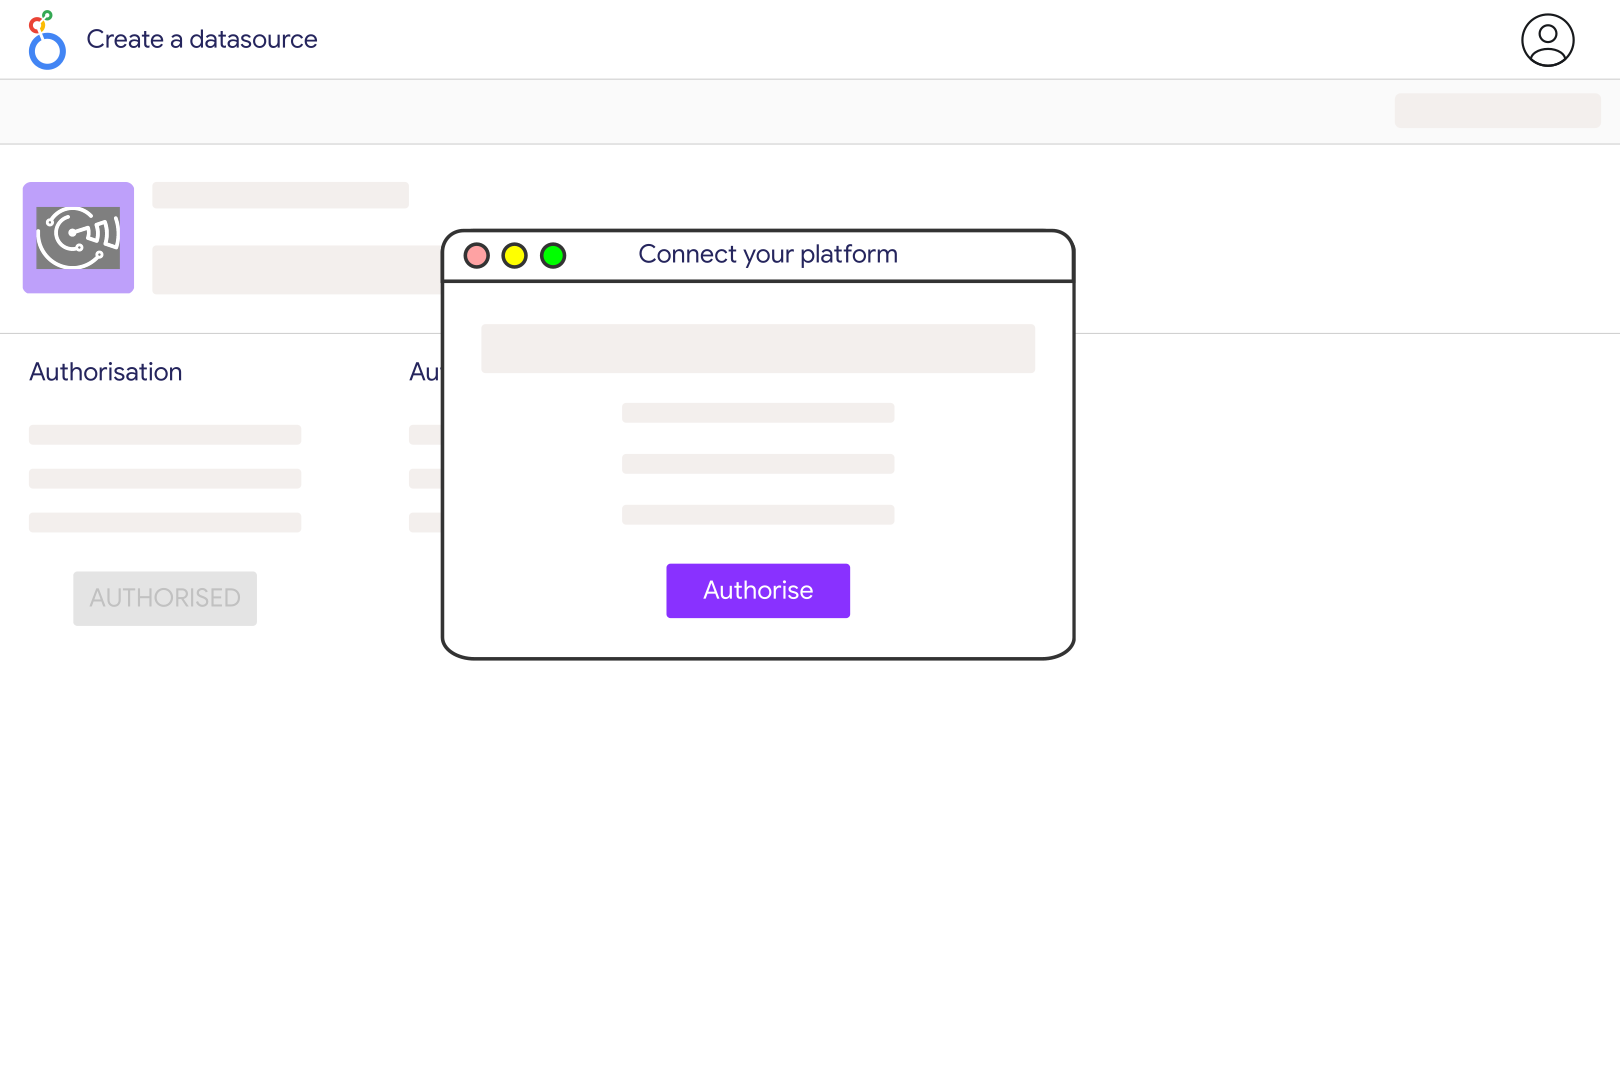
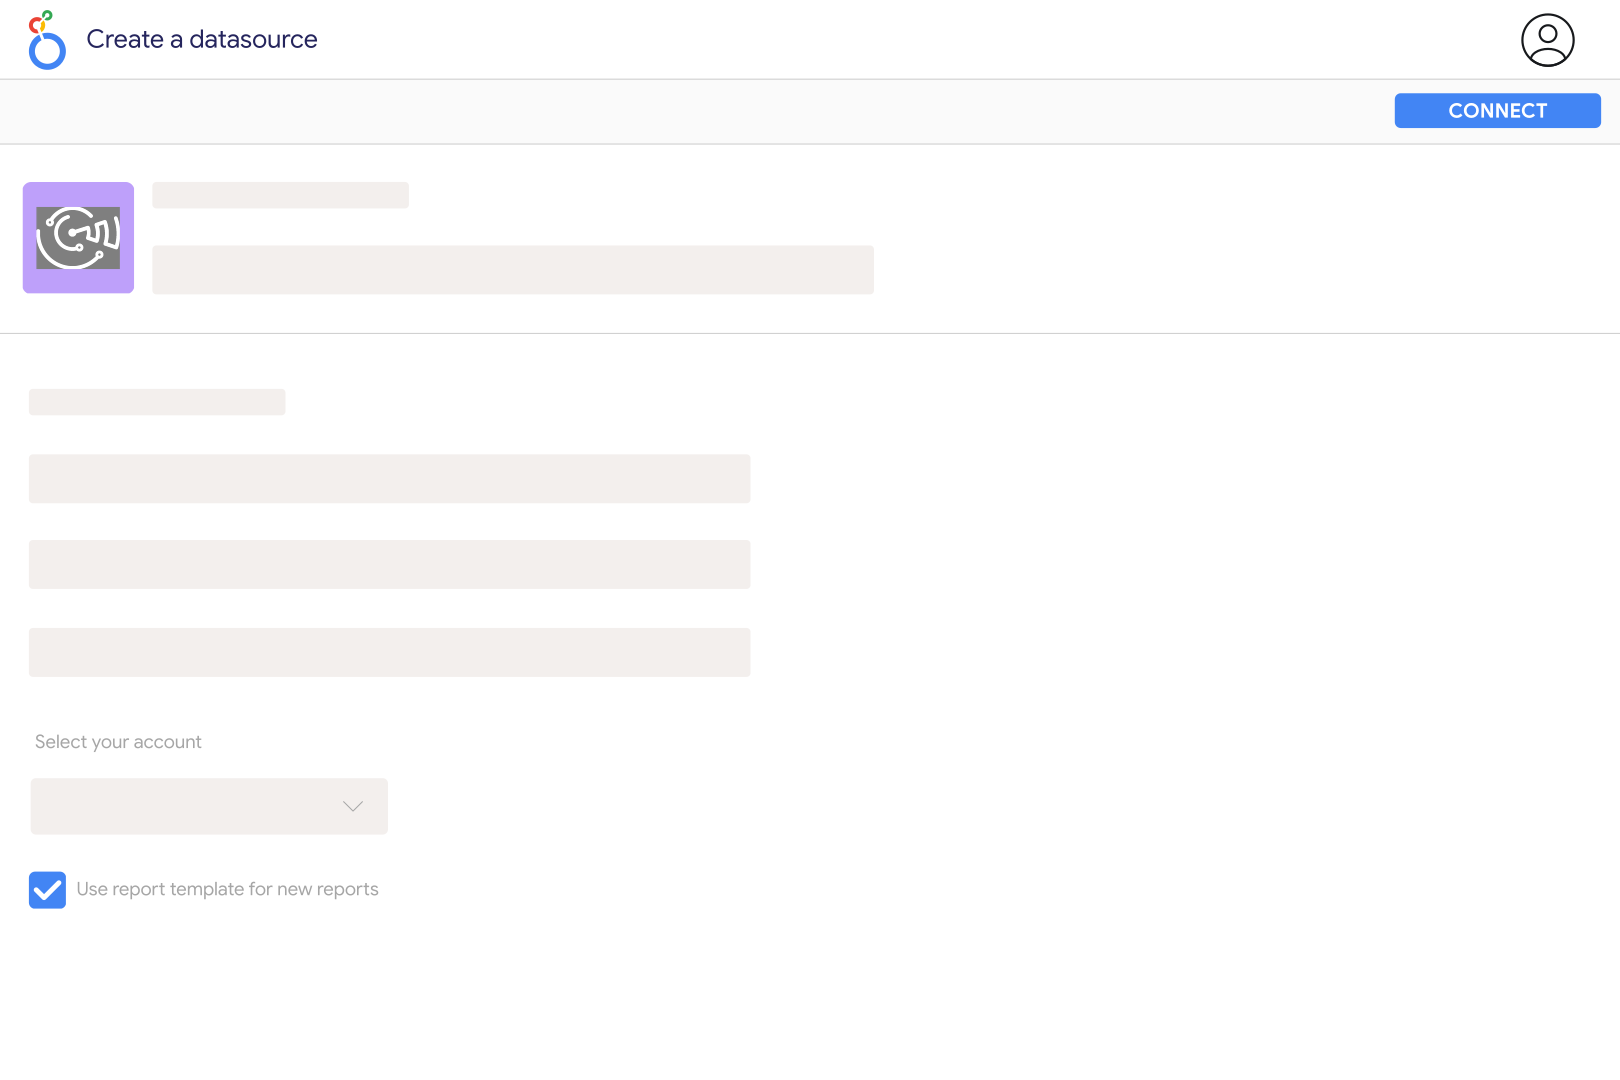
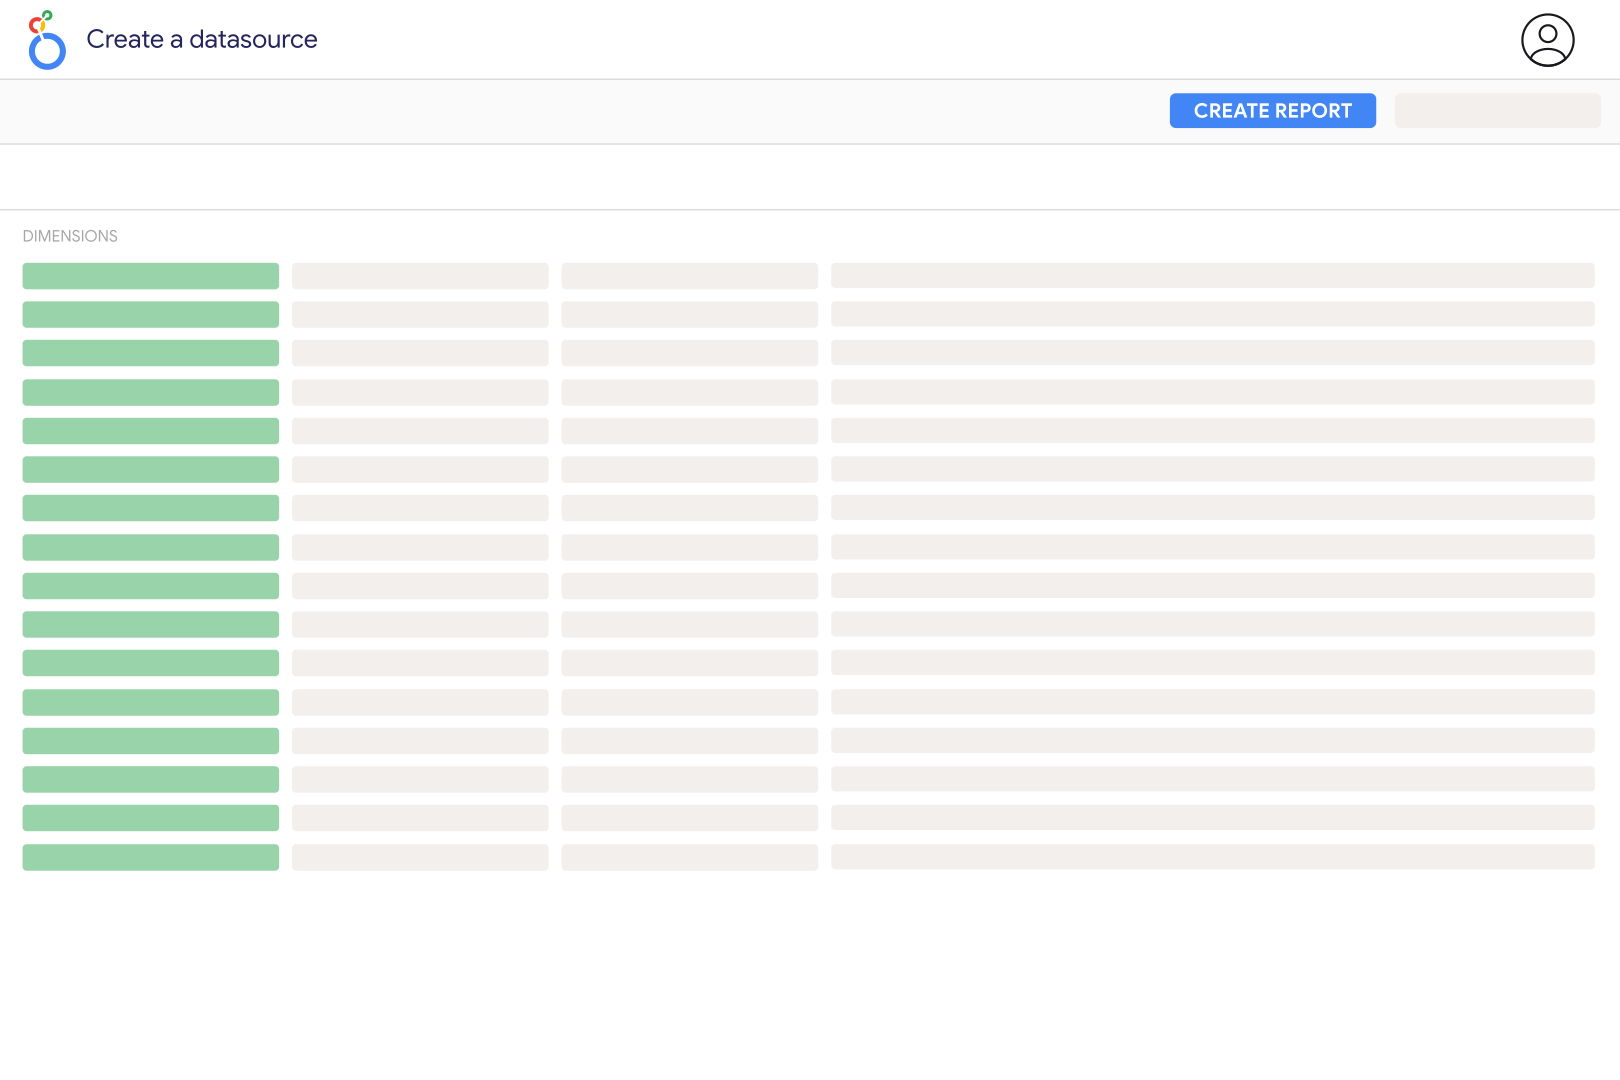
Connect Braze to Catchr using the REST API endpoint for your workspace and a REST API key with read permissions for the resources you want to report on. Use the REST endpoint rather than your Braze dashboard URL. Then open the Catchr Braze connector in Looker Studio, authorize Google, select the source, and create a report.
No. Looker and Looker Studio are separate reporting products. Braze documentation about Looker Blocks or Looker Action Hub describes a different integration. For a Looker Studio dashboard, use the Catchr Braze connector as your data source and build charts from the fields it exposes.
Yes. Catchr exposes campaign and Canvas information, including names and IDs, plus analytics such as sends, opens, conversions, entries, and revenue where Braze returns them. Canvas step and variant identifiers support more detailed analysis. Keep campaign, Canvas, step, and variant totals at their own level of detail to avoid counting the same outcome more than once.
Campaign analytics include a channel dimension, so you can separate the available email, push, SMS, or other channel results. Choose metrics appropriate to each channel: an email open, an SMS opt-out, and a content-card impression do not describe the same interaction. A metric absent for a channel should not automatically be interpreted as zero.
Check the conversion event, attribution window, and reporting level first. Braze exposes conversion measures tied to send time or Canvas entry time as well as other conversion counts. Comparing different time bases can shift results between dates. Use the same measure and filters on both charts, and allow recent periods to change while conversion windows remain open.
Yes. The connector includes segment identifiers, names, and the size metric from Braze segment analytics. Plot size by the returned date to monitor audience changes. Segment size is a count for that date, so adding daily sizes together does not produce a count of distinct people reached during the month.
Yes. Add sources such as Google Ads to compare acquisition spend with lifecycle engagement in one dashboard. Align reporting periods and use a shared campaign mapping when blending. Braze-attributed revenue and advertising-platform conversions use their own attribution rules; combining charts does not create a deduplicated customer journey automatically.
Our team is always here to answer any questions you may have about our data connector.









