
Starter
For freelancers and small teams.
$ 24 /mo
Billed monthly · cancel anytime
Platforms3
Accounts10


Used by the world's leading companies









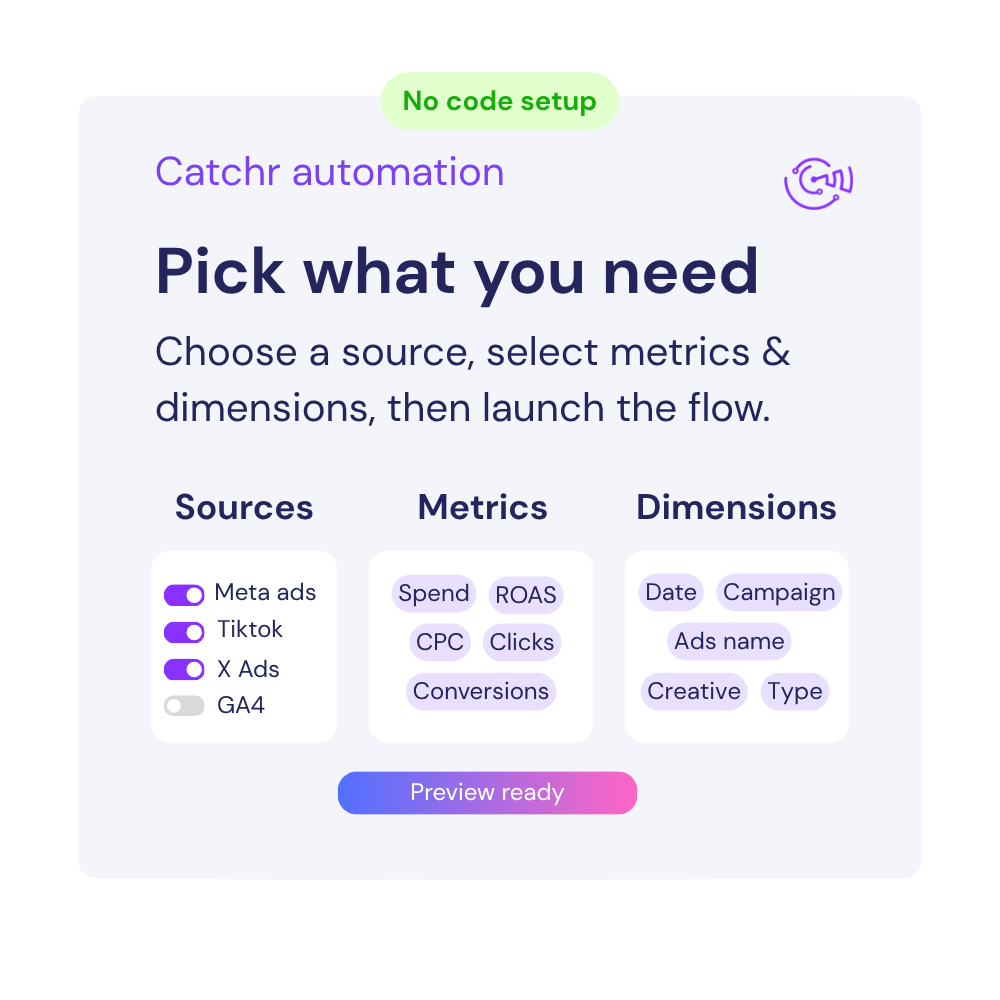
Available metrics
Available dimensions


What our customers say about us.
After three years of use, Catchr has become essential for both our teams and our clients. So far, it has been our best solution for compiling and analyzing data from different advertising platforms. It’s easy to set up, and the customer service is responsive and excellent.

With Catchr’s automated API, we can finally collect and centralize all advertising data, connect it with booking information, and calculate the real ROAS for our restaurant clients. It gives them full visibility, more autonomy, and the ability to optimize campaigns to maximize ROI.

The solution is a real game changer, providing optimal time savings for our data reporting. The major strength of the solution is their highly responsive and professional support.

The direct Adalyser extraction in Catchr is not yet operational. Do not plan a production dashboard around an automatic Adalyser connection until availability is confirmed. For reporting now, export the required report from Adalyser into a structured table and connect it through Google Sheets. Refresh that export when you need updated results.
Start with the reporting date, TV channel, programme or daypart, creative, media cost and the response measure used in your Adalyser analysis. Keep the exported report at a consistent level, such as one row per spot or one row per channel and day. Label the cost and attribution definitions so reviewers know what each total represents.
Baseline traffic is the activity expected without the TV effect being measured. Adalyser uses attribution models to distinguish that background activity from the response associated with TV spots. A rise in website visits after an airing is not automatically all attributable to TV. Preserve the baseline and attributed-response definitions from the source report when charting the results.
TV attribution and website analytics answer different questions. Adalyser models response associated with broadcasts, while website analytics classifies tracked visits and conversions using its own rules. TV can prompt someone to return through search or direct traffic. Compare the same outcome and period, but do not expect channel totals from the two systems to match automatically or add them as separate sales.
Yes, if those breakdowns are included in your Adalyser export. Compare response and cost on the same basis, and consider the volume behind each result before ranking performance. A programme with very few spots can show an unstable average. For an overall cost per lead, divide the relevant total cost by total attributed leads instead of averaging row-level CPL values.
No. Importing a report transfers the values and breakdowns that the report contains. Looker Studio can chart them and calculate ratios, but it does not recreate Adalyser’s TV-response model. If attribution settings or source data change, generate an updated export before comparing results. Keep a record of the settings used for recurring reports.
Yes. Combine the Adalyser export with sources such as Google Ads and Facebook Ads. Align dates, currencies and cost definitions, and show attribution results separately by measurement system. A sale influenced by TV may also receive credit in a digital ad platform, so adding those claims can overstate total sales.
Our team is always here to answer any questions you may have about our data connector.









