Home > Destinations > Data Studio (ex Looker Studio) > Google Analytics

Connect Google Analytics to Data Studio (ex Looker Studio)

Connect Google Analytics to Data Studio (ex Looker Studio) and and build automated dashboards without CSV exports, spreadsheets, or manual API setup.

Looker Studio
Power BI
Google Sheets
BigQuery
Snowflake

Used by the world's leading companies

Why do agencies use Catchr for Google Analytics reporting in Data Studio (Looker Studio)?

Catchr lets media buyers and agencies stop rebuilding Google Analytics reports by hand: the data lands in Data Studio ready to chart, for every ad account you manage.

No manual csv export

Stop downloading files from Google Analytics every time a client report, spreadsheet, or dashboard needs fresh numbers.

Connected in minutes

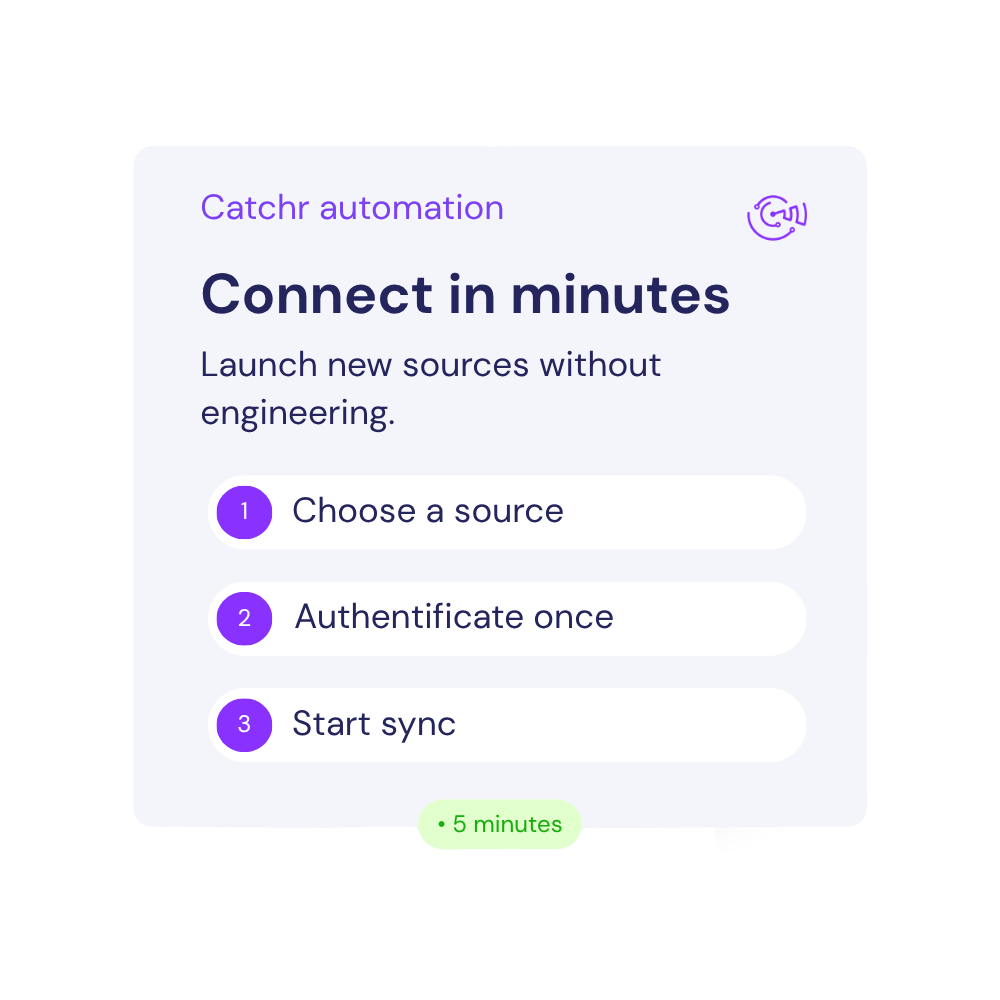
Your first Google Analytics report can be live in a few minutes. Authorize your Google Analytics account, pick your ad accounts, and your data source is ready.

Built for agencies with many Analytics accounts

Pull several Analytics accounts into one data source, then filter by account to build a report per client or brand in the same Data Studio file.

Google Analytics to Looker Studio pricing

Choose your plan by the number of platforms and accounts you report on.

Starter

For freelancers and small teams.

$ 24 /mo

Billed monthly · cancel anytime

Platforms3
Accounts10
Start free trial

Growth

For agencies managing more clients.

$ 239 /mo

Billed monthly · cancel anytime

Platforms10
Accounts100
Start free trial

Scale

For teams reporting at scale.

$ 599 /mo

Billed monthly · cancel anytime

Platforms25
Accounts500
Start free trial

How to connect Google Analytics to Data Studio with Catchr?

To connect Google Analytics to Looker Studio (Data Studio), open the Catchr connector, authorize your Google Analytics account, select the ad accounts you want to report on, then create your report.

1. Open the Catchr Google Analytics connector in Looker Studio

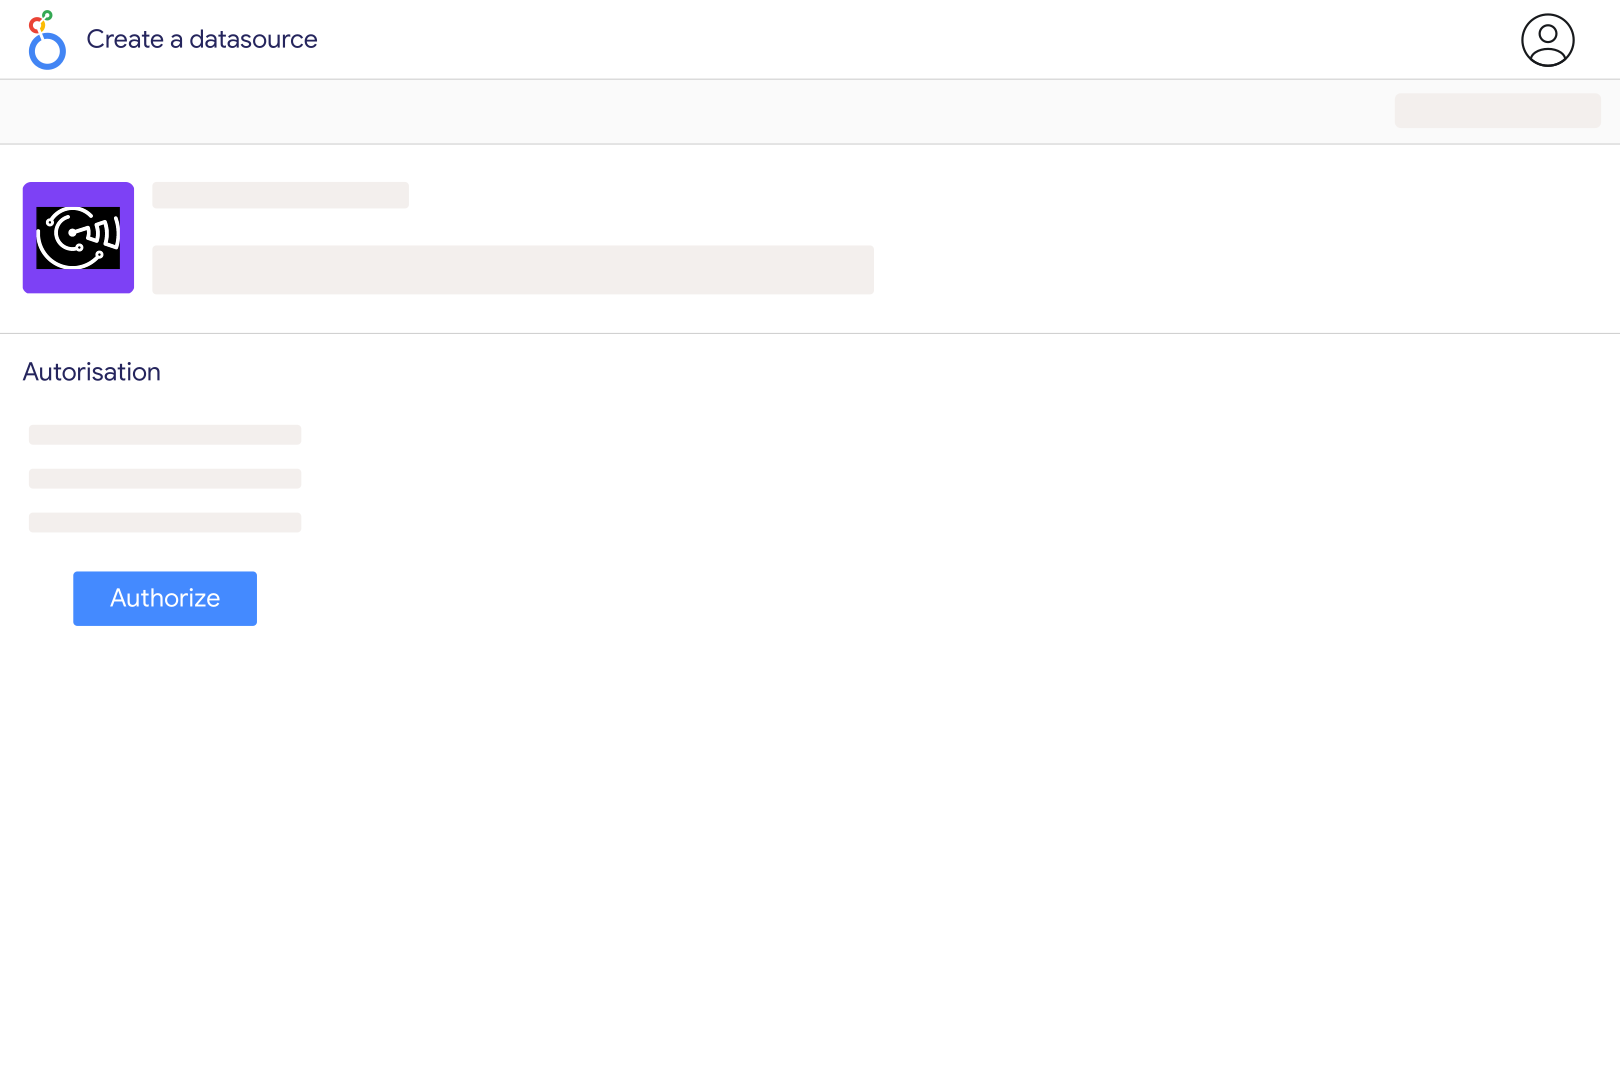
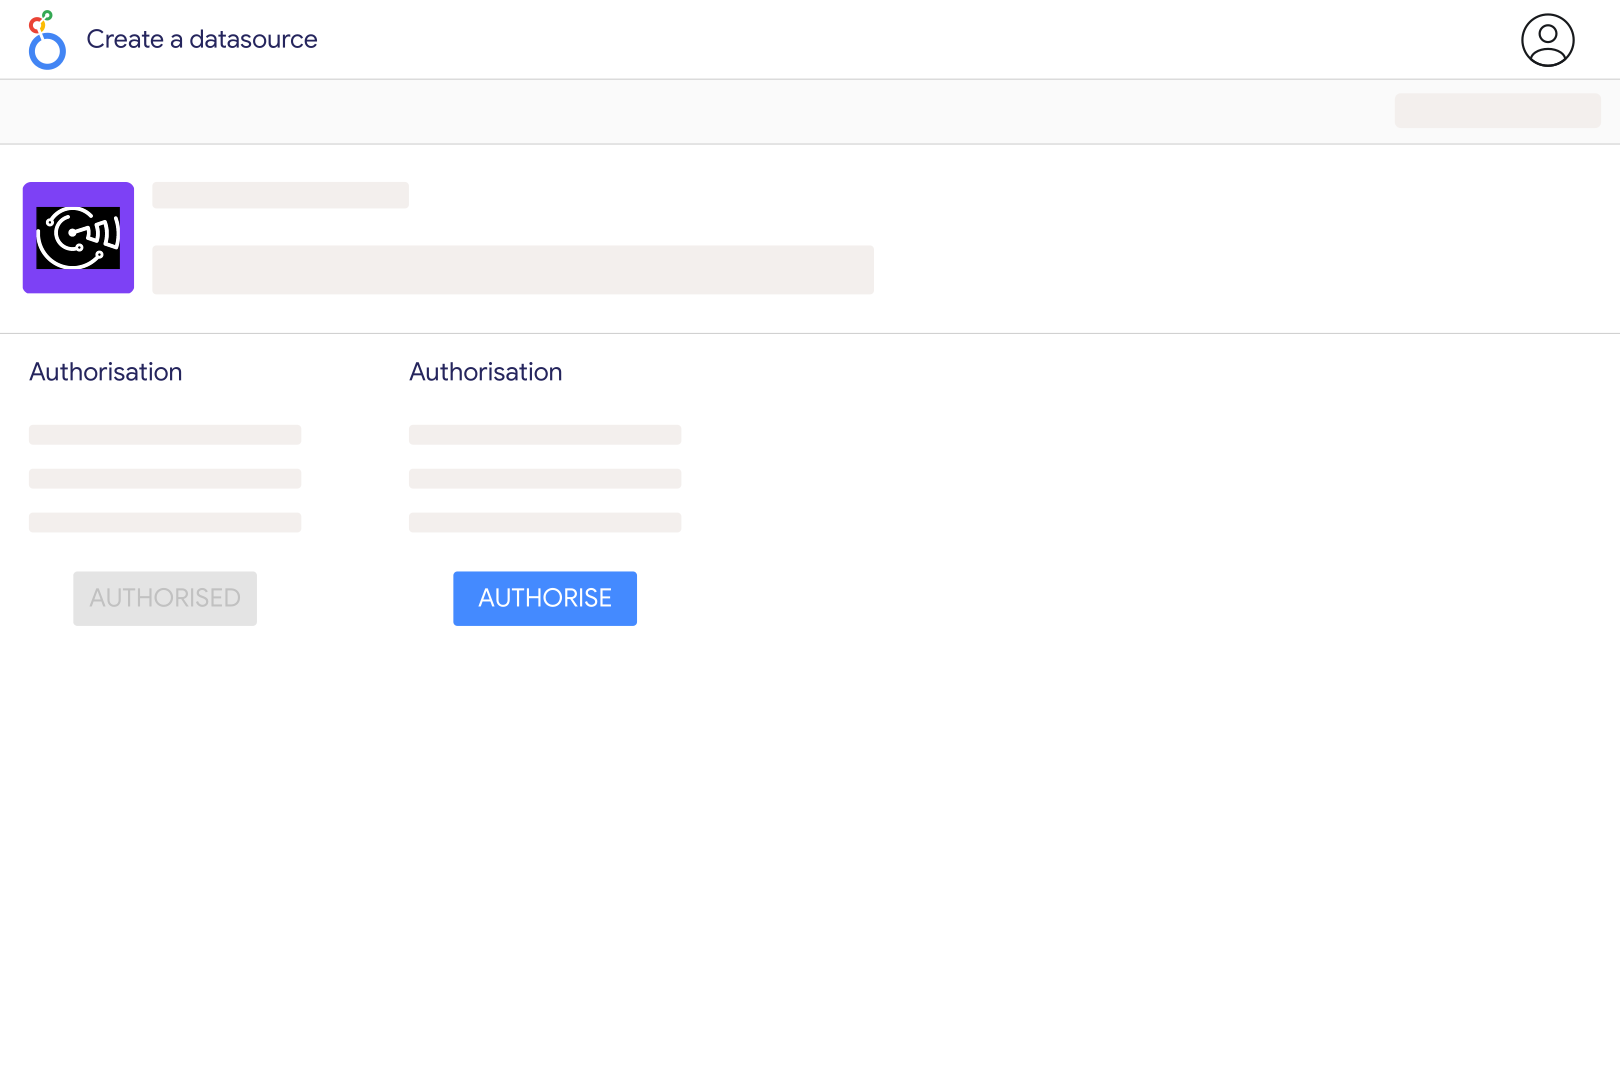
Click the connector link to open it inside Looker Studio. You will be asked to authorize the connector before creating your data source.

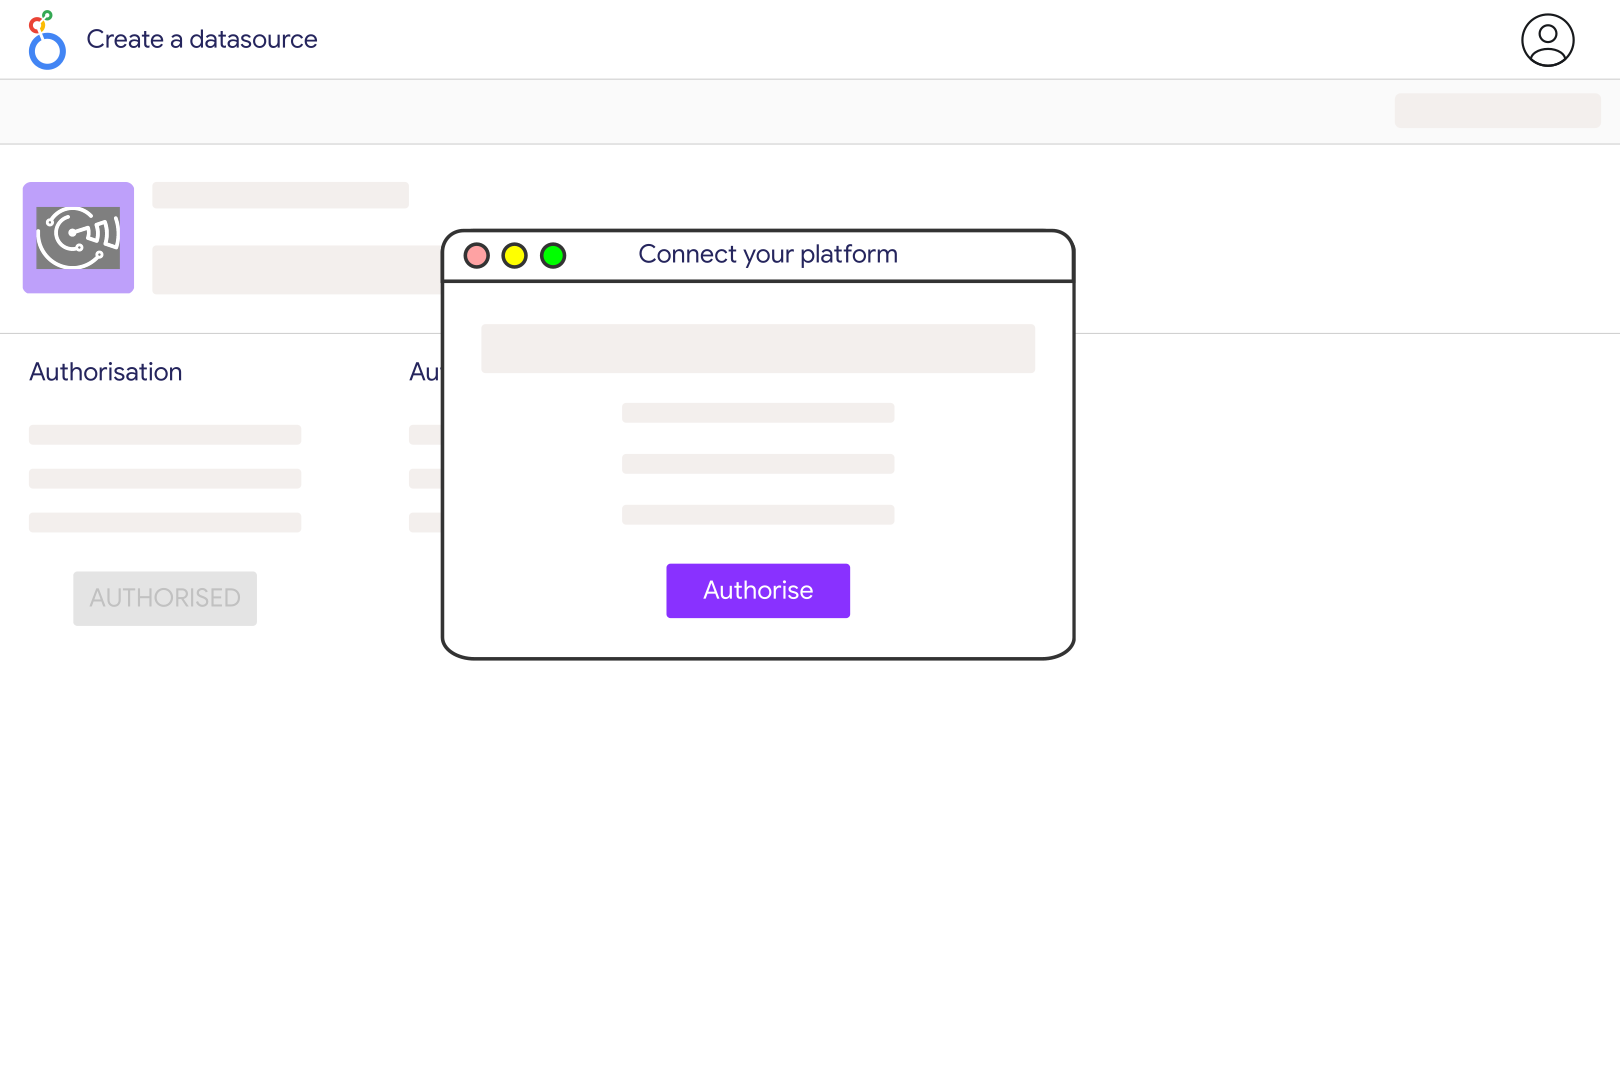
2. Authorize Looker Studio (Data Studio) and Catchr

Choose the Google account you use for Looker Studio and authorize Catchr to create a secure Google Analytics data source.

3. Connect your Google Analytics account

Sign in with your Google Analytics account that has access to the accounts you want to report on. Make sure your user has the right Google Analytics permissions.

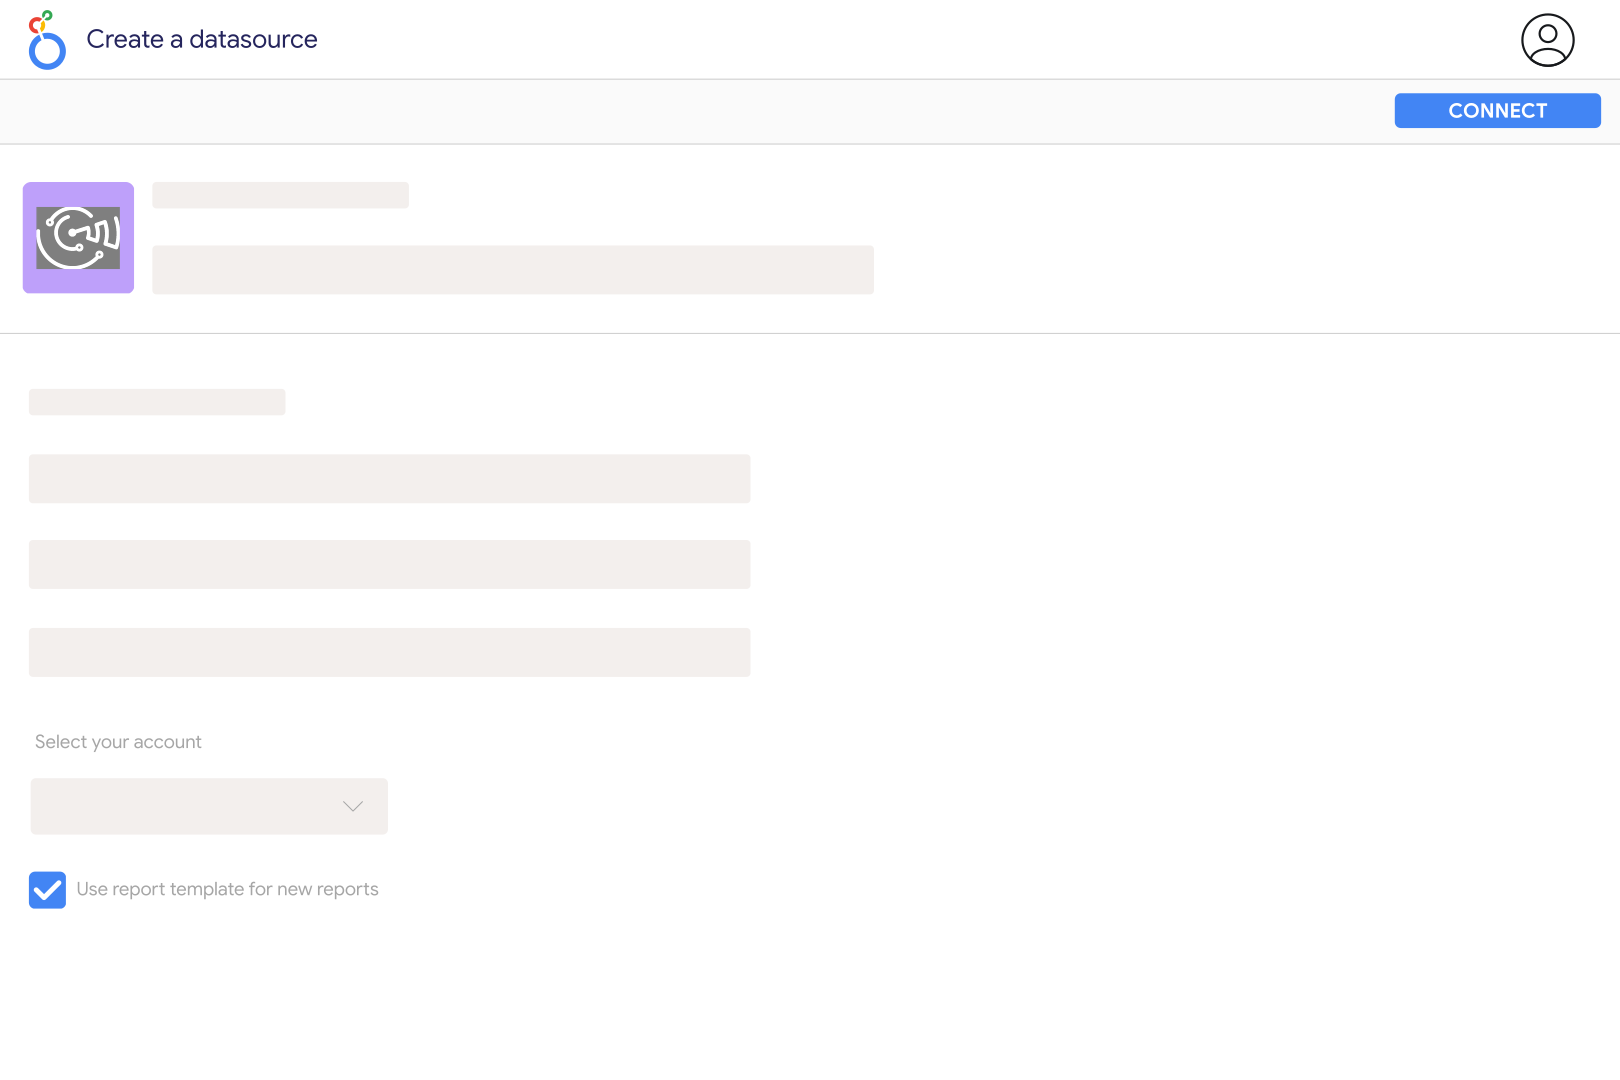
4. Select your Google Analytics accounts

Choose one or several Analytics accounts, depending on the report you want to build.

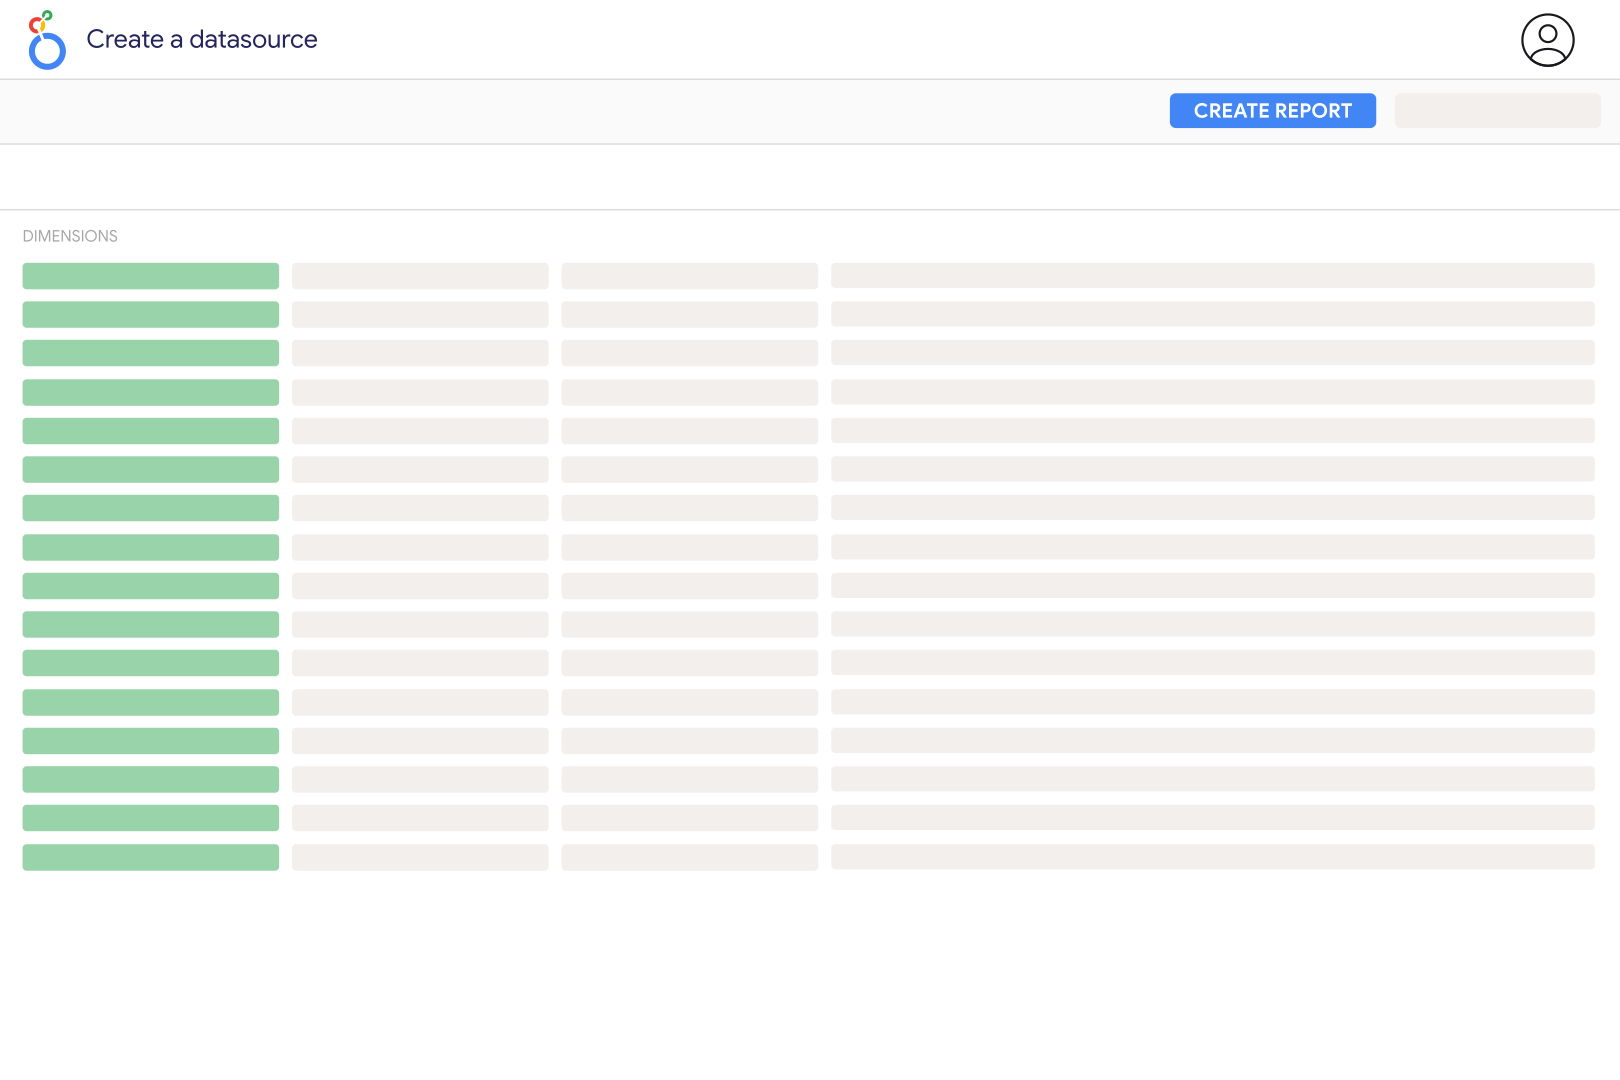
5. Create your Data Studio report

Click Create report, then add charts, scorecards, tables, filters, and date controls using your Google Analytics metrics and dimensions.

6. Customize your dashboard

Use Sessions, Active users, Conversions, Total revenue, Engagement rate, Return on ad spend, Session source / medium, Session campaign, Default channel group, Google Ads campaign, Region, Month of the year and many more.

Google Analytics metrics and dimensions available in Data Studio

Access 81 metrics and 207 dimensions from Google Analytics connectors including Sessions, Active users, Conversions, Total revenue, Engagement rate, Return on ad spend, Session source / medium, Session campaign, Default channel group, Google Ads campaign, Region, Month of the year more.

81

Available metrics

207

Available dimensions

Build better Google Analytics dashboards in Data Studio (ex Looker Studio)

Use Catchr to create dashboards that show what is working, what is wasting budget, and where performance is changing.

Client reporting for agencies

Create clean Looker Studio dashboards for each client with with Sessions, Active users, Conversions, Total revenue, Engagement rate, Return on ad spend always up to date.

Budget pacing

Compare daily spend with the monthly budget of each campaign, so overspend shows up mid-month instead of on the invoice.

Review what drives results across

Compare to see where budget, traffic, or revenue is improving and where performance is dropping.

Compare with your other channels

Combine with your others marketing to understand performance across your full acquisition journey.

Keep an eye on Google Analytics performance

Track Google Analytics Sessions, Active users, Conversions, Total revenue, Engagement rate, Return on ad spend in refreshable Data Studio dashboards so you can spot changes before they become reporting problems.

Customer testimonials

What our customers say about us.

85 %
Faster
Reporting time

After three years of use, Catchr has become essential for both our teams and our clients. So far, it has been our best solution for compiling and analyzing data from different advertising platforms. It’s easy to set up, and the customer service is responsive and excellent.

Valentin Keravel
CEO, Laio – Agency

With Catchr’s automated API, we can finally collect and centralize all advertising data, connect it with booking information, and calculate the real ROAS for our restaurant clients. It gives them full visibility, more autonomy, and the ability to optimize campaigns to maximize ROI.

Corentin Largeron
Freelance
30
hours saved

The solution is a real game changer, providing optimal time savings for our data reporting. The major strength of the solution is their highly responsive and professional support.

Corentin Largeron
CEO at The Browz – Agency

Google Analytics to Data Studio (ex Looker Studio): FAQ

Answers to common questions about connecting data to spreadsheets, dashboards, AI assistants, and reporting tools with Catchr.

How do I connect GA4 to Looker Studio with Catchr?

Authorize Google Analytics in Catchr using a Google account with access to the GA4 property. Select that property in the Catchr Looker Studio connector and create your report. Start with sessions and engagement by date, then add traffic-source and landing-page breakdowns that answer your reporting questions.

Do I need a paid connector to use GA4 in Looker Studio?

No. Google provides a native Google Analytics connector for GA4. Catchr offers another route for agencies managing analytics alongside advertising and other platforms. Choose based on the fields and connection workflow you need, rather than assuming that a paid connector is necessary for every GA4 dashboard.

Which GA4 metrics should I use for an acquisition report?

Use sessions to measure visits, engaged sessions to assess visit quality, and revenue where ecommerce tracking is configured. Pair those with session source and medium for a visit-based acquisition view. Active users answer a different question: how many distinct active people were measured. Catchr's GA4 fields include these metrics and session-level traffic-source dimensions.

Why do my user totals change when I add daily rows?

A person who visits on several days can appear in each daily count but only once in a distinct-user total for the whole period. Adding daily user counts therefore does not produce the period's unique users. Keep a separate scorecard for the full date range and use the daily chart to show the trend.

Why does Looker Studio not match my GA4 Exploration?

The native GA4 connector is designed around reporting data, and Google notes that this does not necessarily match Explorations. Before comparing, align the property, dates, filters, metric definition and dimension scope. Compare sessions with sessions and active users with active users; similar-looking labels can describe different populations.

Can a connector remove GA4 API quota limits?

No connector can promise to bypass Google's property-level API quotas. Complex requests, many charts and frequent reloads can consume the available allowance. Reduce unnecessary charts and long date ranges, reuse data sources where practical and allow exhausted quotas to recover. A connector subscription and Google's API capacity are separate constraints.

Can I compare GA4 results with advertising spend?

Yes. Add Google Ads or your other advertising sources to the report. Agree on campaign naming, dates and currency before blending. Use the result to compare acquisition cost with website outcomes, while keeping GA4 attribution distinct from the conversions each advertising platform claims.

Should I use session source or first user source?

Use session source when you want to explain which channel brought a visit. Use first user source when you want to describe how a user was first acquired. These answer different questions, so give charts clear titles and avoid swapping one dimension for the other when comparing campaign performance.

Still have a question ? 

Our team is always here to answer any questions you may have about our data connector.