
Starter
For freelancers and small teams.
$ 24 /mo
Billed monthly · cancel anytime
Platforms3
Accounts10










Available metrics
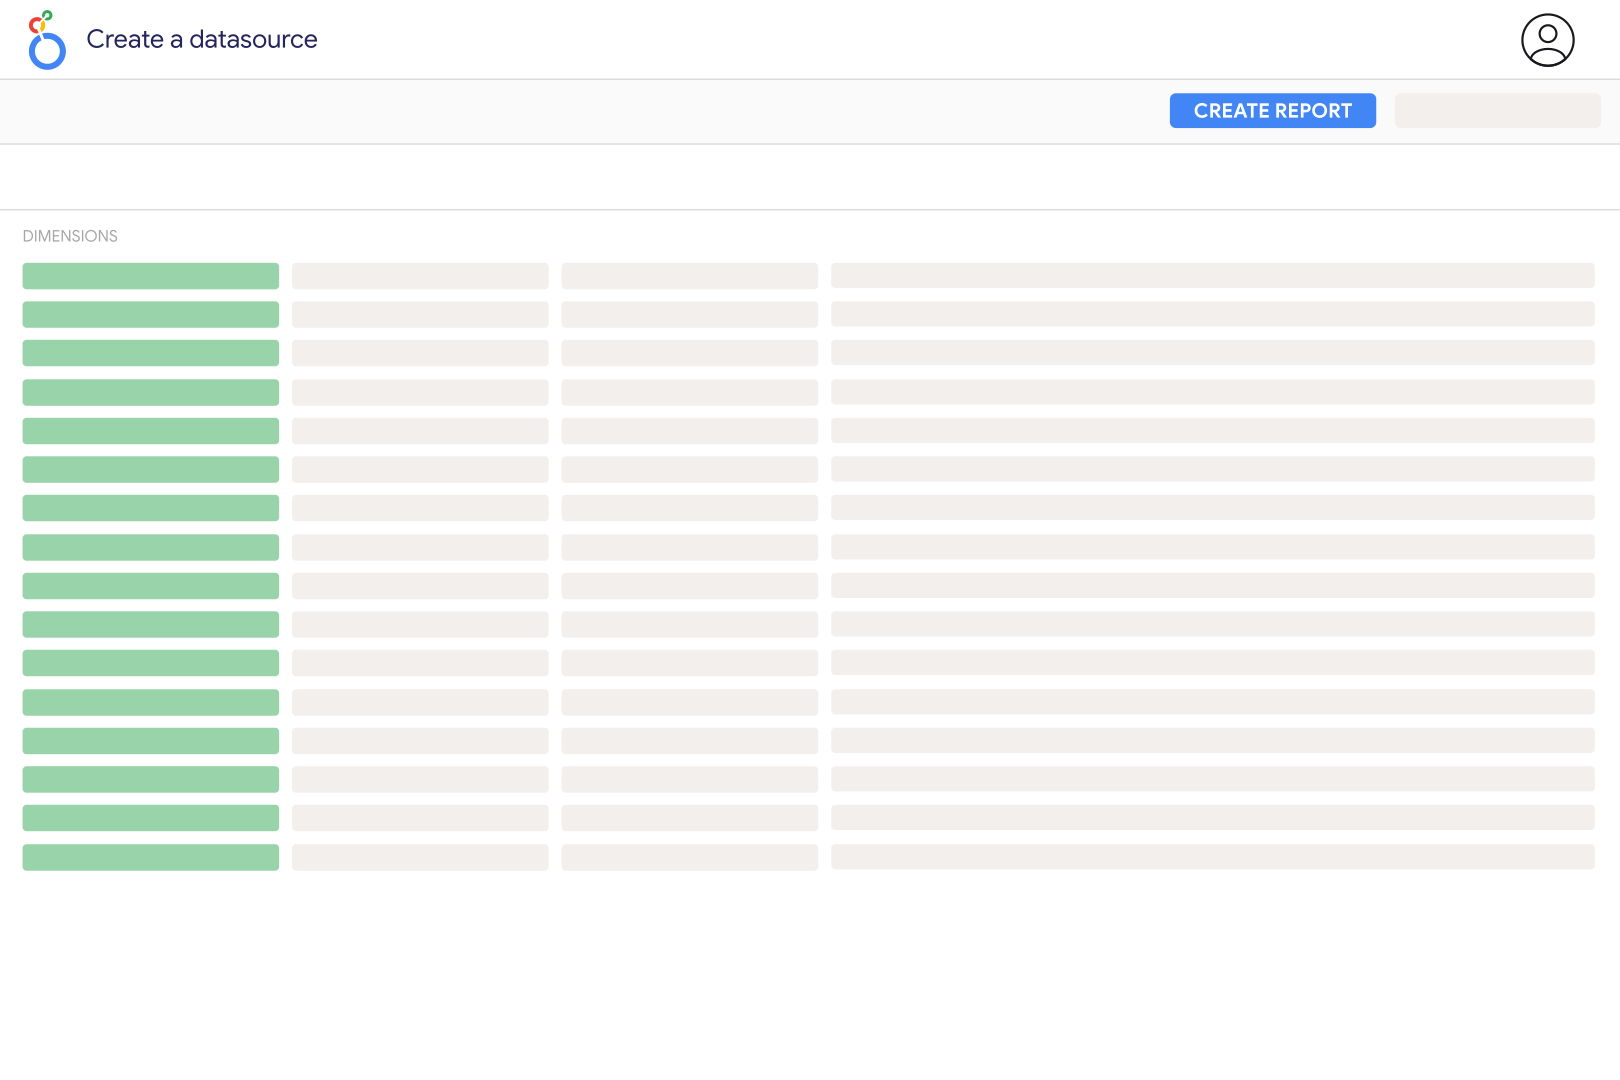
Available dimensions


What our customers say about us.
After three years of use, Catchr has become essential for both our teams and our clients. So far, it has been our best solution for compiling and analyzing data from different advertising platforms. It’s easy to set up, and the customer service is responsive and excellent.

With Catchr’s automated API, we can finally collect and centralize all advertising data, connect it with booking information, and calculate the real ROAS for our restaurant clients. It gives them full visibility, more autonomy, and the ability to optimize campaigns to maximize ROI.

The solution is a real game changer, providing optimal time savings for our data reporting. The major strength of the solution is their highly responsive and professional support.

Confirm current direct-connector availability with Catchr before planning an automated report. For an immediately usable alternative, download a Search Ads performance report, import it into Google Sheets and connect that worksheet to Looker Studio. Include the account, campaign and date fields needed for your charts. A worksheet connection does not automatically fetch new advertising exports.
No. Search and Display use separate reports and should remain identifiable in your dashboard. Use Search Ads reports for keyword and search-query performance, and Yahoo! Japan Display Ads reports for display and video delivery. Add both datasets to a shared dashboard when you need an overview, retaining a source label and the appropriate account identifiers.
A keyword is a targeting term in your account; a search query is the term a person searched for. Use the Search query report to examine the searches associated with your ads, and keep Keyword and Search Query in clearly labelled columns. This helps you review irrelevant traffic and useful new targeting ideas without confusing what you bid on with what people typed.
Conversions reflects the actions selected for optimization, while Conversions (all) can include actions outside those selections. Account and campaign conversion-group settings affect the comparison. Check the same conversion action and counting method in both reports; do not add these two columns together, because their counts overlap.
Search Ads uses different report types for account totals, keywords, search queries, assets and other analyses. Fields must share a compatible report type, and some combinations are explicitly disallowed. Start with one reporting purpose, such as search queries with clicks and cost, then add fields gradually. Keep incompatible analyses in separate charts instead of assuming every field can be combined.
Calculate CTR as total Clicks divided by total Impressions and CPC as total Cost divided by total Clicks. For ROAS, divide the selected conversion-value total by Cost, making sure the value represents the outcome you intend to measure and uses a compatible currency. Avoid adding daily ratios or mixing Conv. value with Conv. value (all) between comparison periods.
Yes. Add Google Ads to compare spend, clicks and conversion performance across search platforms. Align dates, currencies and conversion definitions, and use source plus account ID to distinguish records. If Yahoo! Japan data comes from an export, display its update date so an older file is not mistaken for a current automated report.
Our team is always here to answer any questions you may have about our data connector.









