
Starter
For freelancers and small teams.
$ 24 /mo
Billed monthly · cancel anytime
Platforms3
Accounts10


Used by the world's leading companies










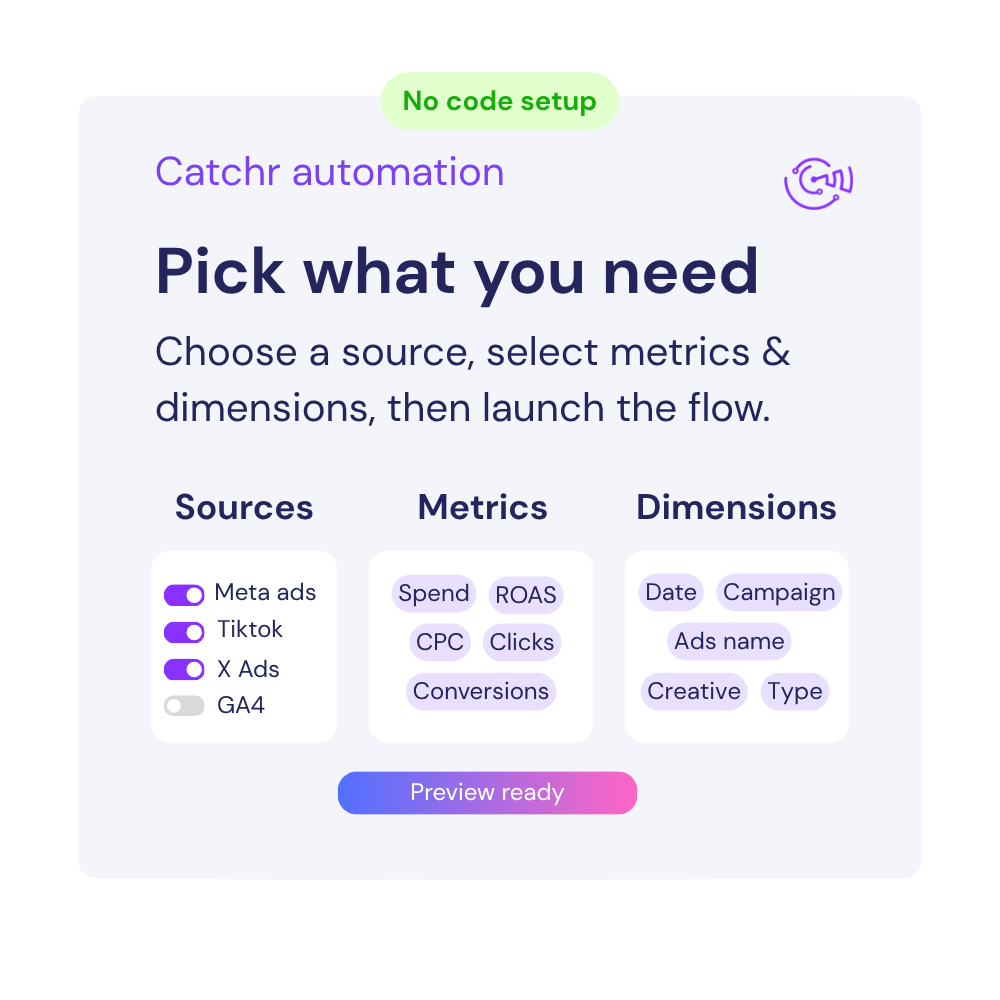
Available metrics
Available dimensions


What our customers say about us.
After three years of use, Catchr has become essential for both our teams and our clients. So far, it has been our best solution for compiling and analyzing data from different advertising platforms. It’s easy to set up, and the customer service is responsive and excellent.

With Catchr’s automated API, we can finally collect and centralize all advertising data, connect it with booking information, and calculate the real ROAS for our restaurant clients. It gives them full visibility, more autonomy, and the ability to optimize campaigns to maximize ROI.

The solution is a real game changer, providing optimal time savings for our data reporting. The major strength of the solution is their highly responsive and professional support.

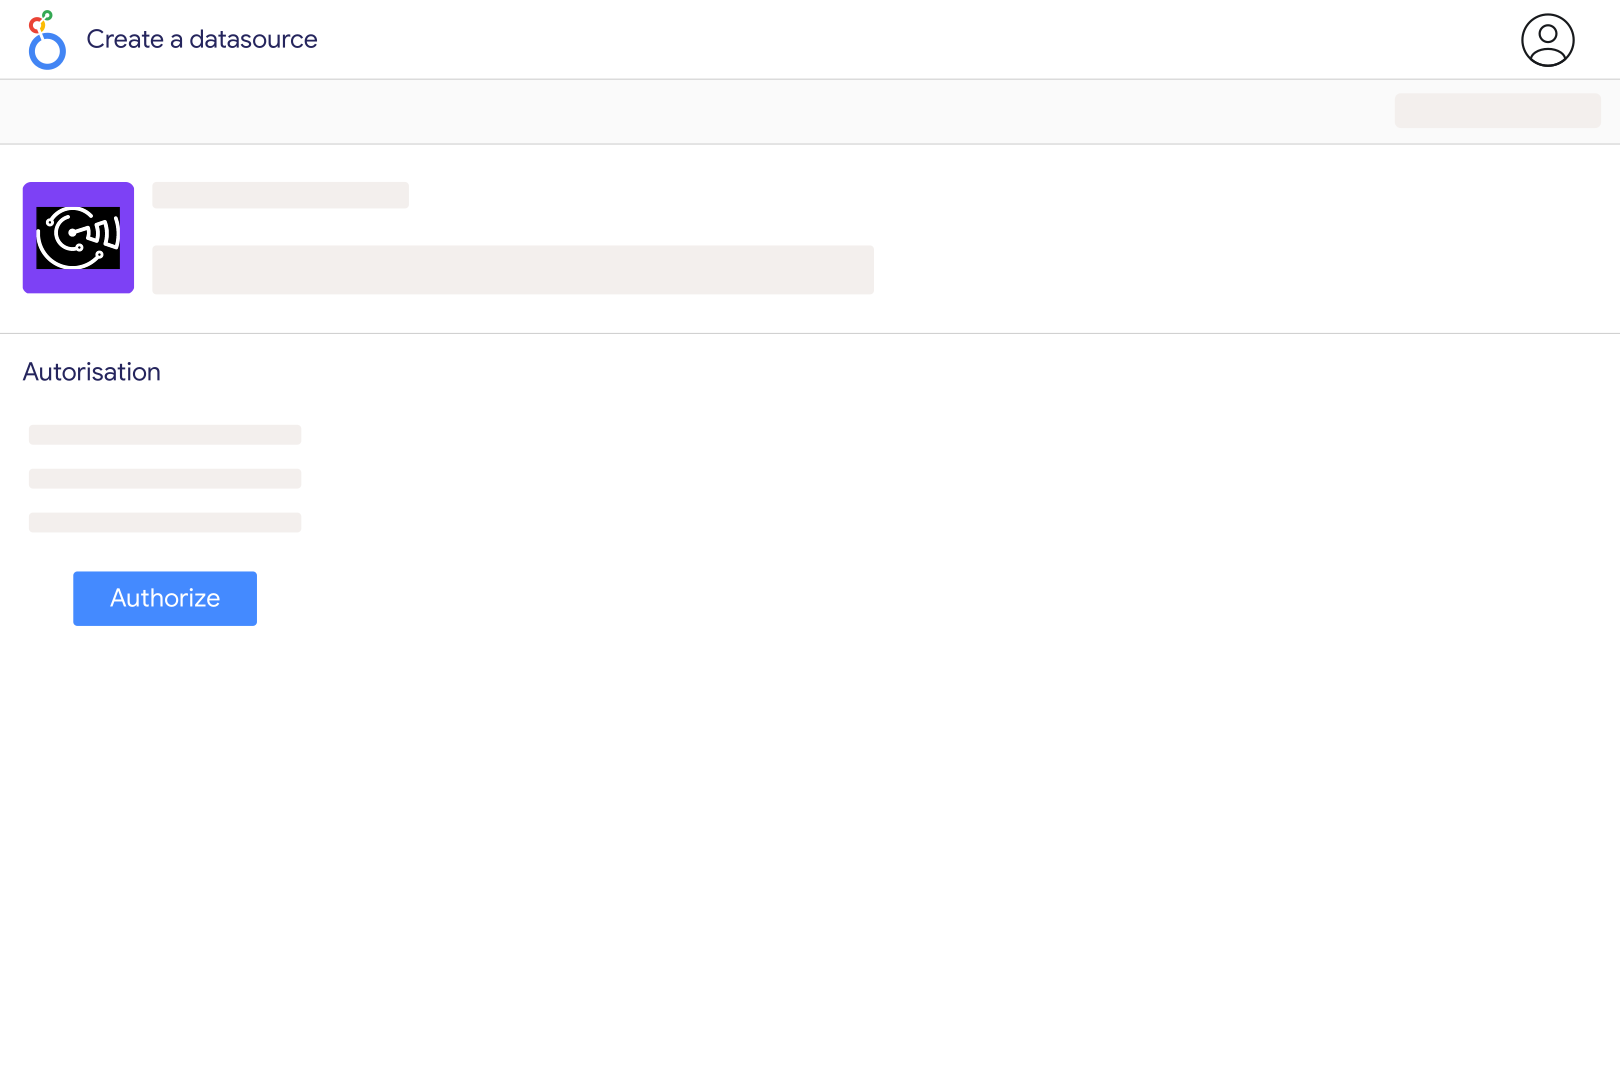
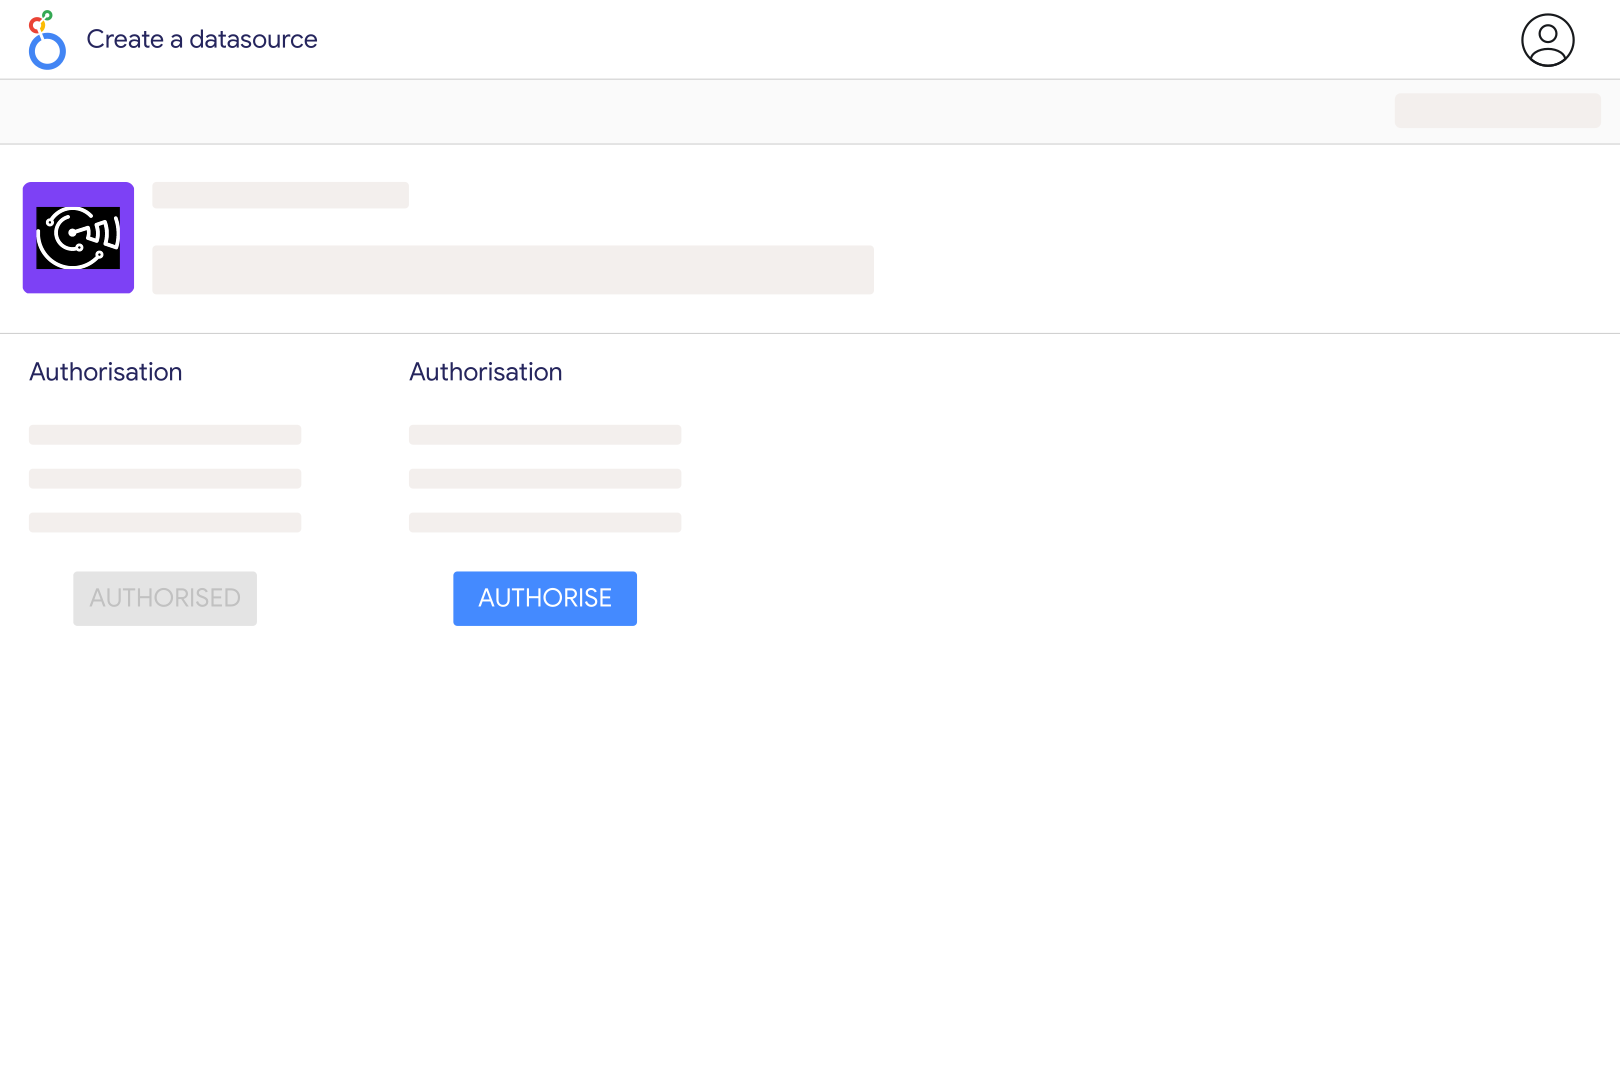
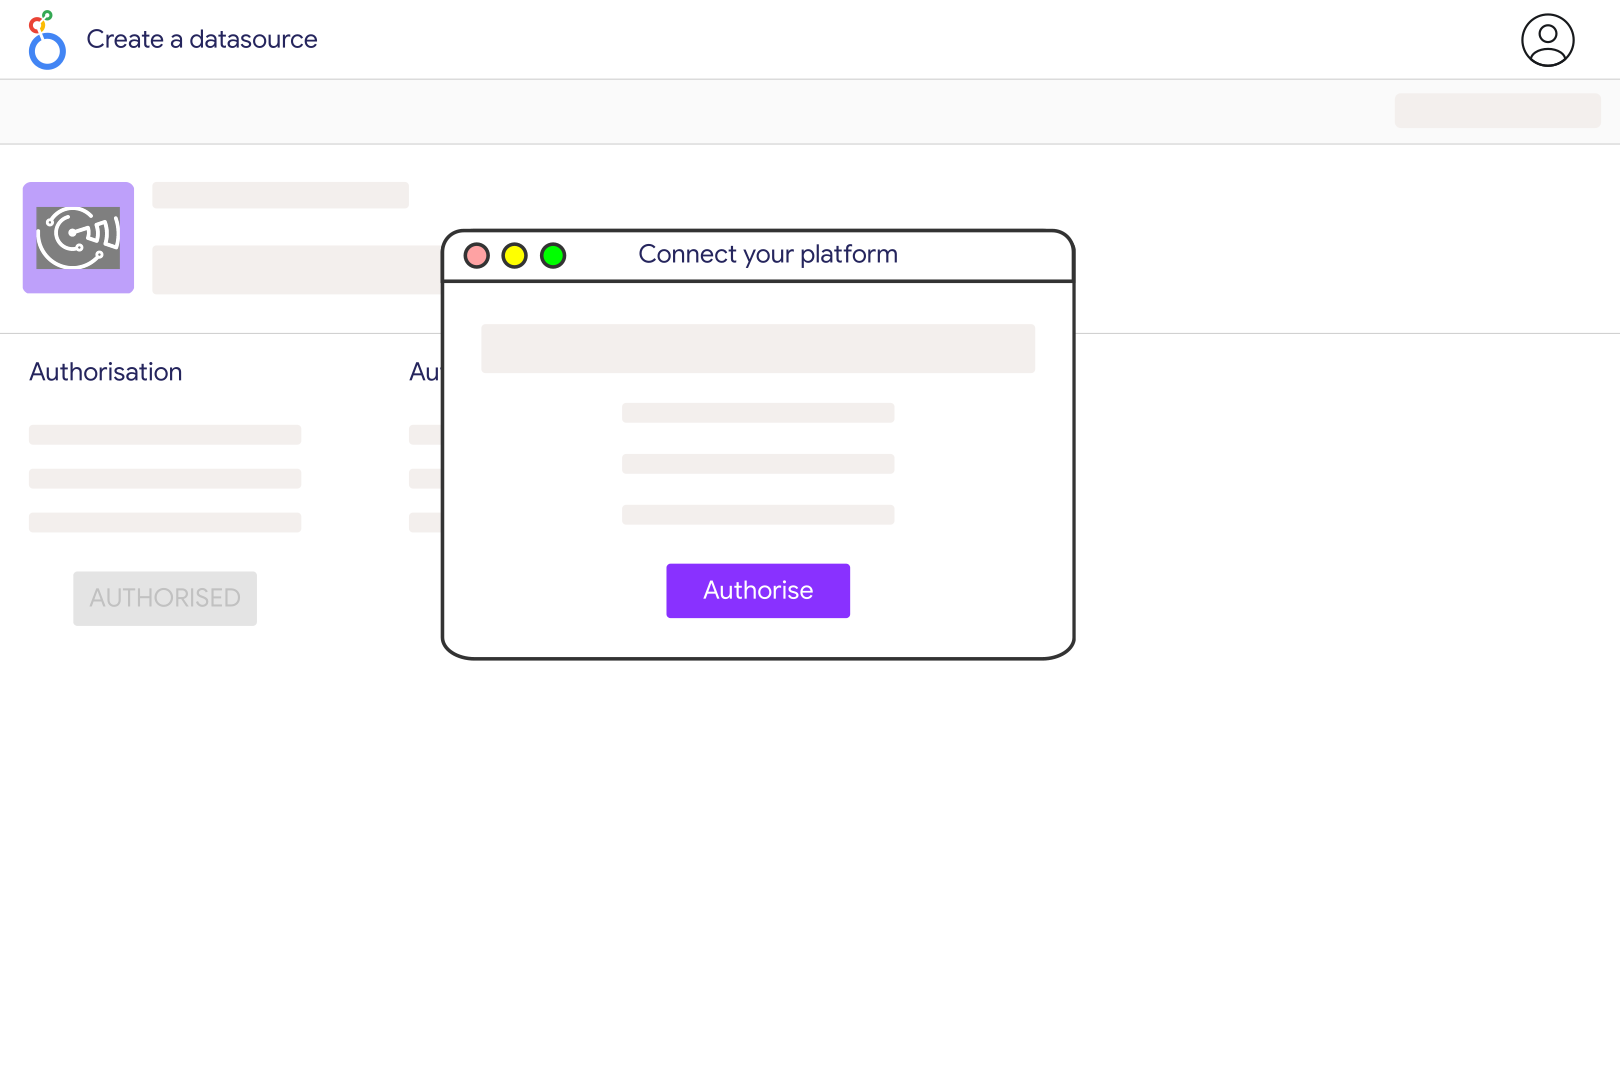
Add a Taboola connection in Catchr using your Taboola API Client ID and Client Secret, then select the advertiser account you want to report on. Open the Catchr connector in Looker Studio and create a data source from that account. Start with Date, Campaign Name, Total Spent and Clicks to check that the account and reporting period are correct.
Catchr includes Total Spent, Impressions, Visible Impressions, Clicks, CPC, CPM, CTR, conversion actions, conversion value and ROAS. Campaign, publisher site, country and platform fields support more detailed analysis in compatible reports. Use delivery metrics to understand traffic, then add the conversion measures that match your campaign goal rather than treating every recorded action as a purchase.
These are separate measures in Taboola reporting. Use Impressions with CTR and CPM, and Visible Impressions with VCTR and VCPM. Changing the denominator changes the rate, so the two metric families are not interchangeable. When calculating an overall rate across campaigns, divide the summed clicks or spend by the appropriate summed impression count instead of averaging campaign rates.
Yes. Use Site Name to compare publisher performance and Platform or OS Family for device-related analysis. Build charts with compatible dimensions: the Taboola API offers predefined report breakdowns, so every combination is not available in one table. Start with one breakdown and add campaign or date fields only where that report supports them.
The Catchr field catalog includes CPA Actions Number from Clicks and CPA Actions Number from Views, alongside separate click and view conversion rates and ROAS fields. Use the family that matches the attribution comparison you need. Do not add an overall conversion metric to its click and view components, and confirm which conversion events contribute to the selected totals in Taboola.
Match the advertiser account, reporting dates, time zone, campaign filters and conversion columns first. Check whether the interface uses visible impressions or all impressions and whether you are comparing click-only or broader conversion results. For totals, calculate CPC from total spend divided by total clicks. Recent conversions and cached report data can also make two reports fetched at different times disagree.
Yes. Add Outbrain or Google Ads to the same report and compare spend, traffic and clearly defined outcomes. Align currencies, dates and conversion definitions first. Two platforms may claim the same sale, so summing their attributed conversions does not give a deduplicated count of customers.
Our team is always here to answer any questions you may have about our data connector.









