
Starter
For freelancers and small teams.
$ 24 /mo
Billed monthly · cancel anytime
Platforms3
Accounts10










Available metrics
Available dimensions


What our customers say about us.
After three years of use, Catchr has become essential for both our teams and our clients. So far, it has been our best solution for compiling and analyzing data from different advertising platforms. It’s easy to set up, and the customer service is responsive and excellent.

With Catchr’s automated API, we can finally collect and centralize all advertising data, connect it with booking information, and calculate the real ROAS for our restaurant clients. It gives them full visibility, more autonomy, and the ability to optimize campaigns to maximize ROI.

The solution is a real game changer, providing optimal time savings for our data reporting. The major strength of the solution is their highly responsive and professional support.

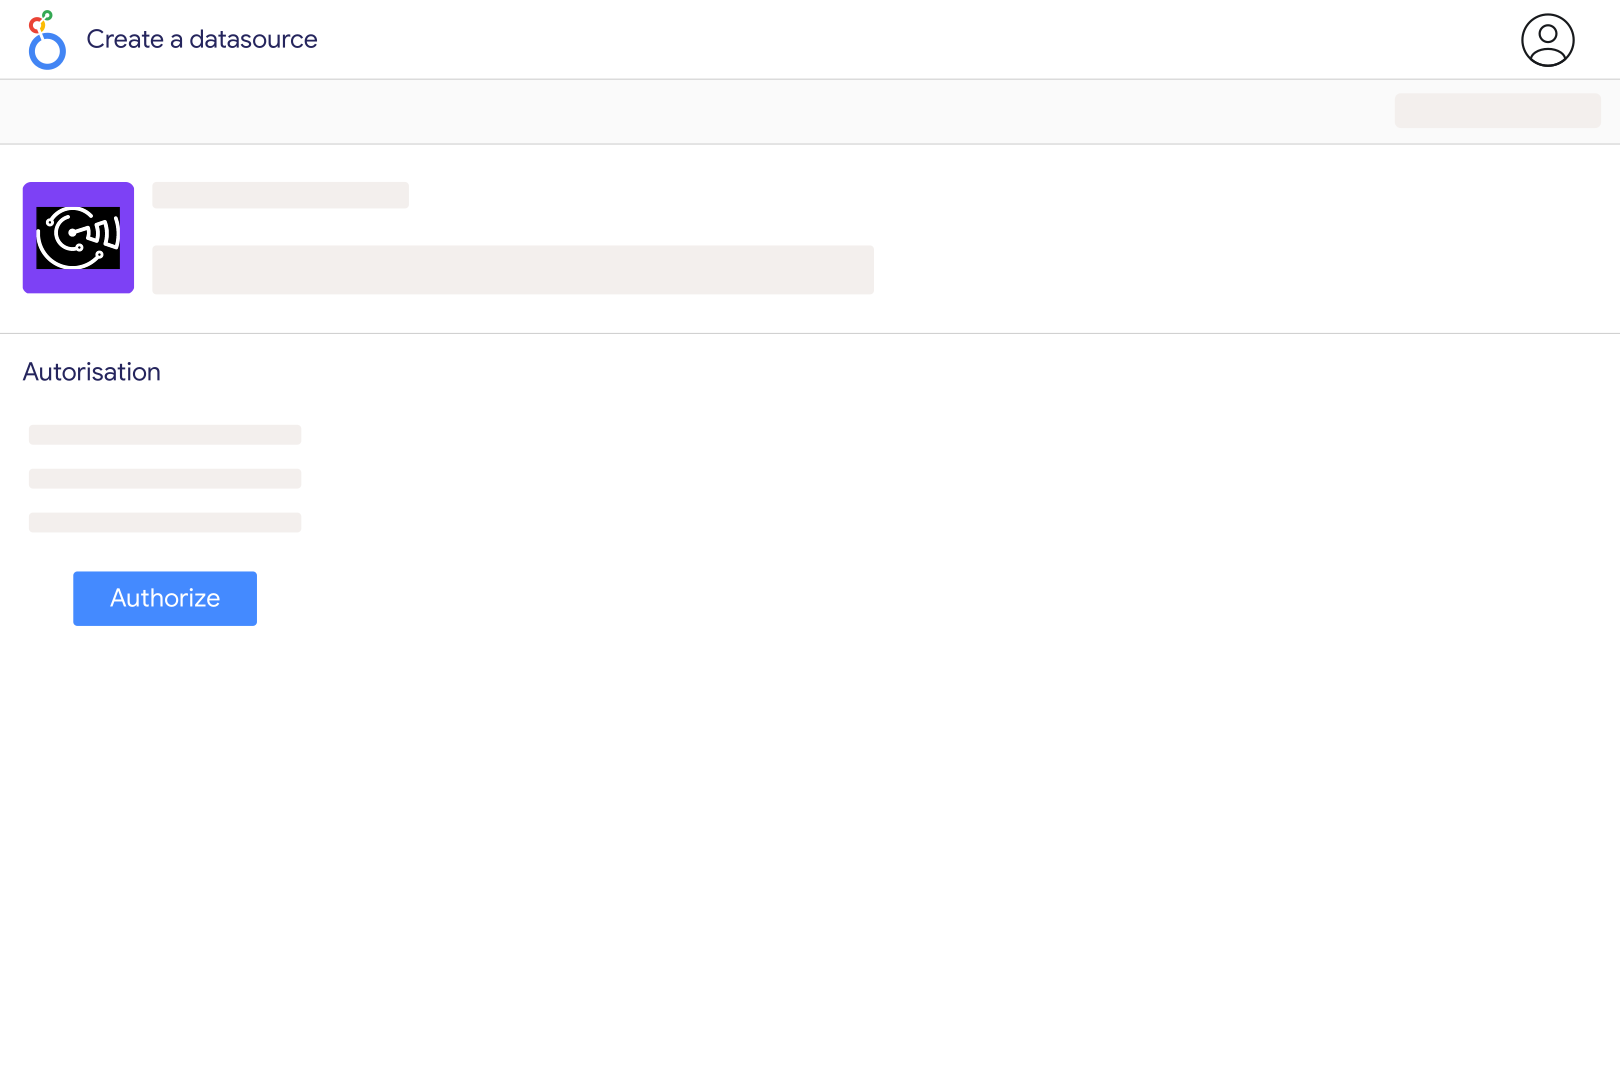
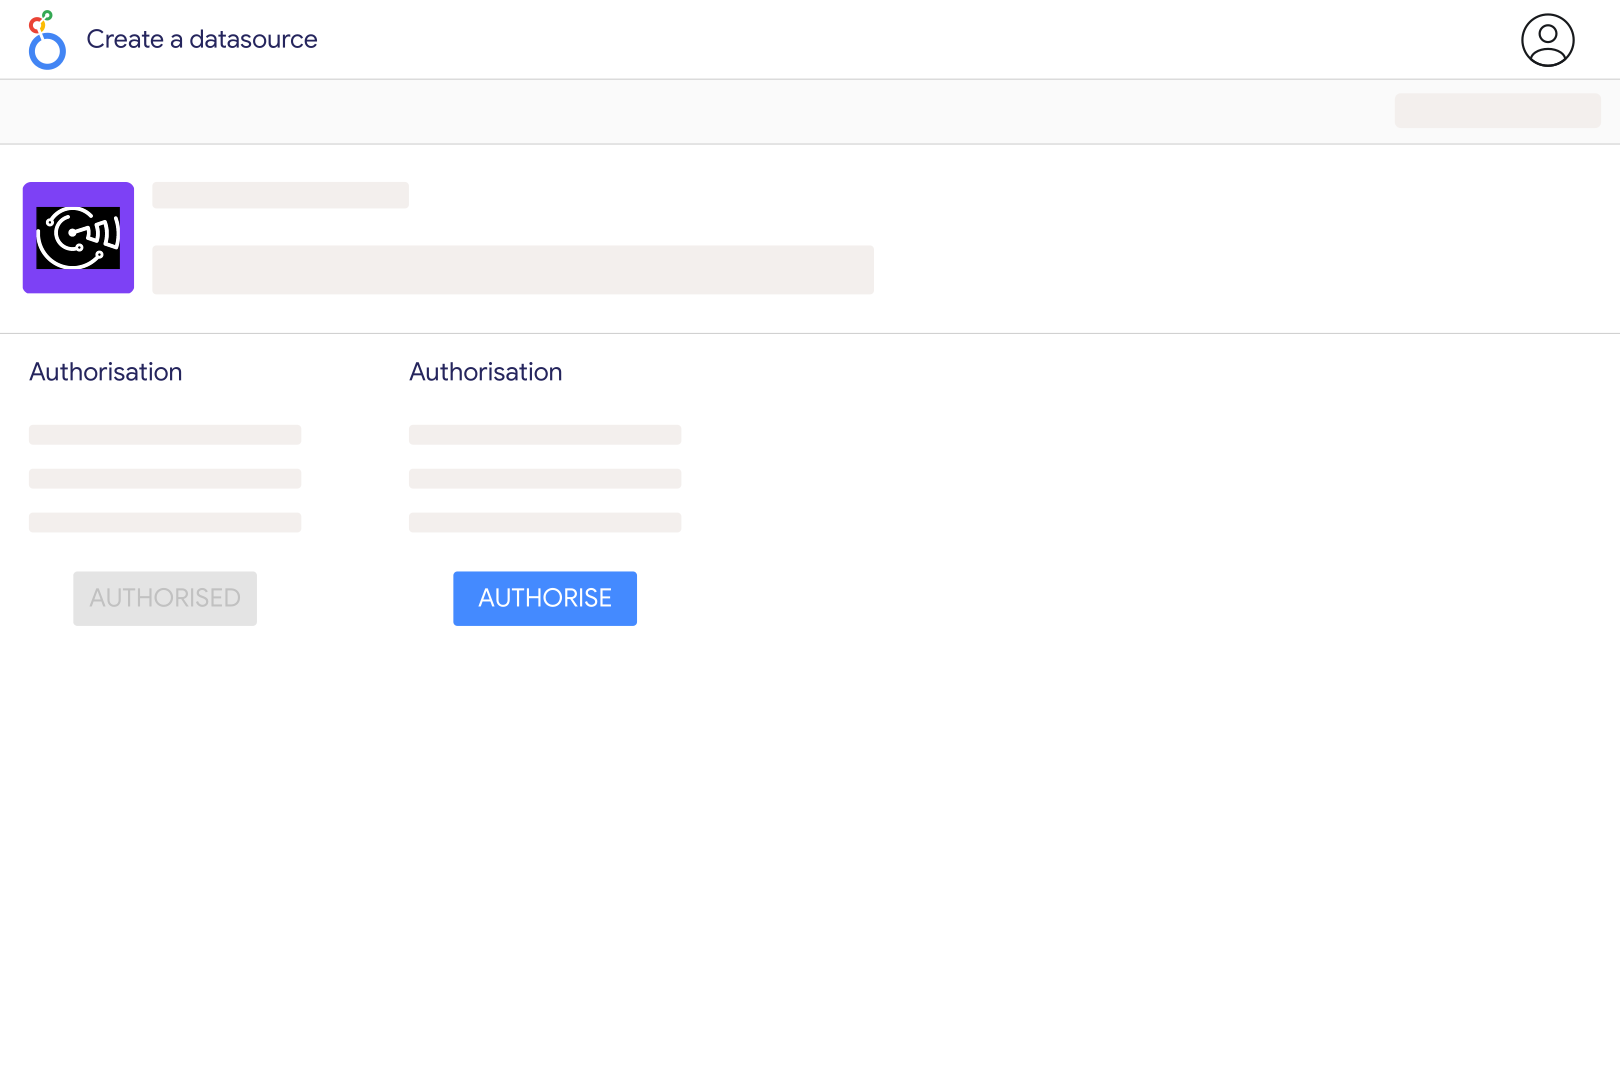
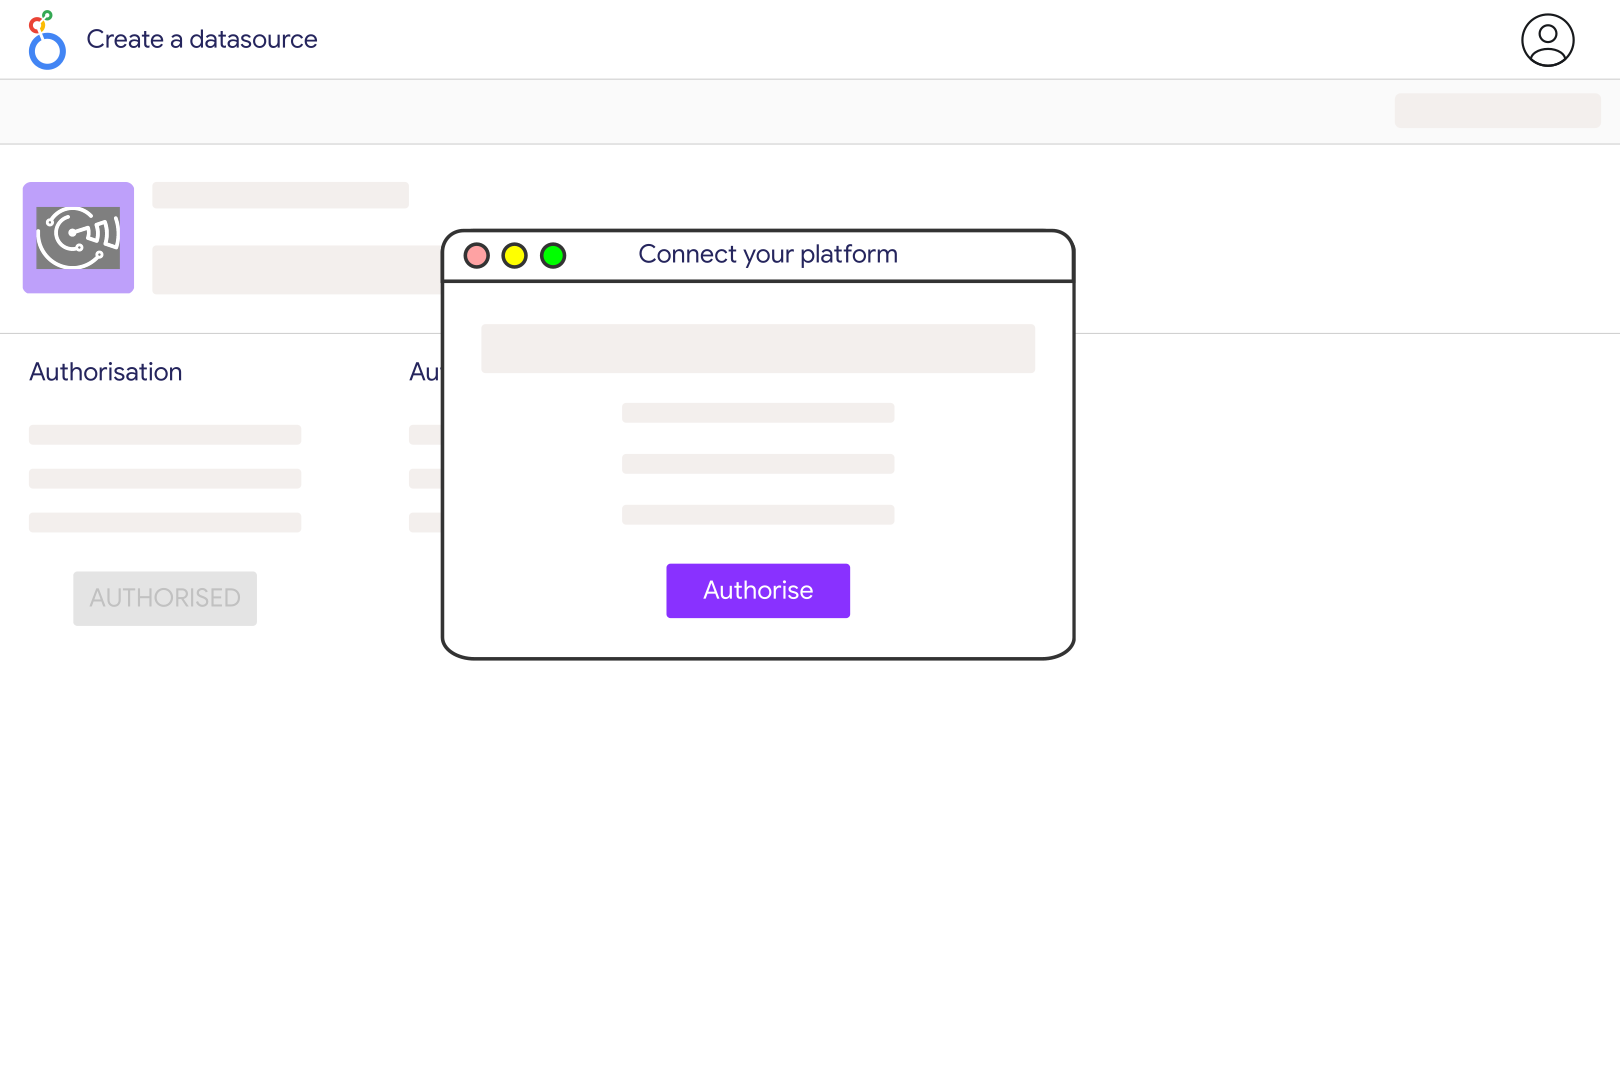
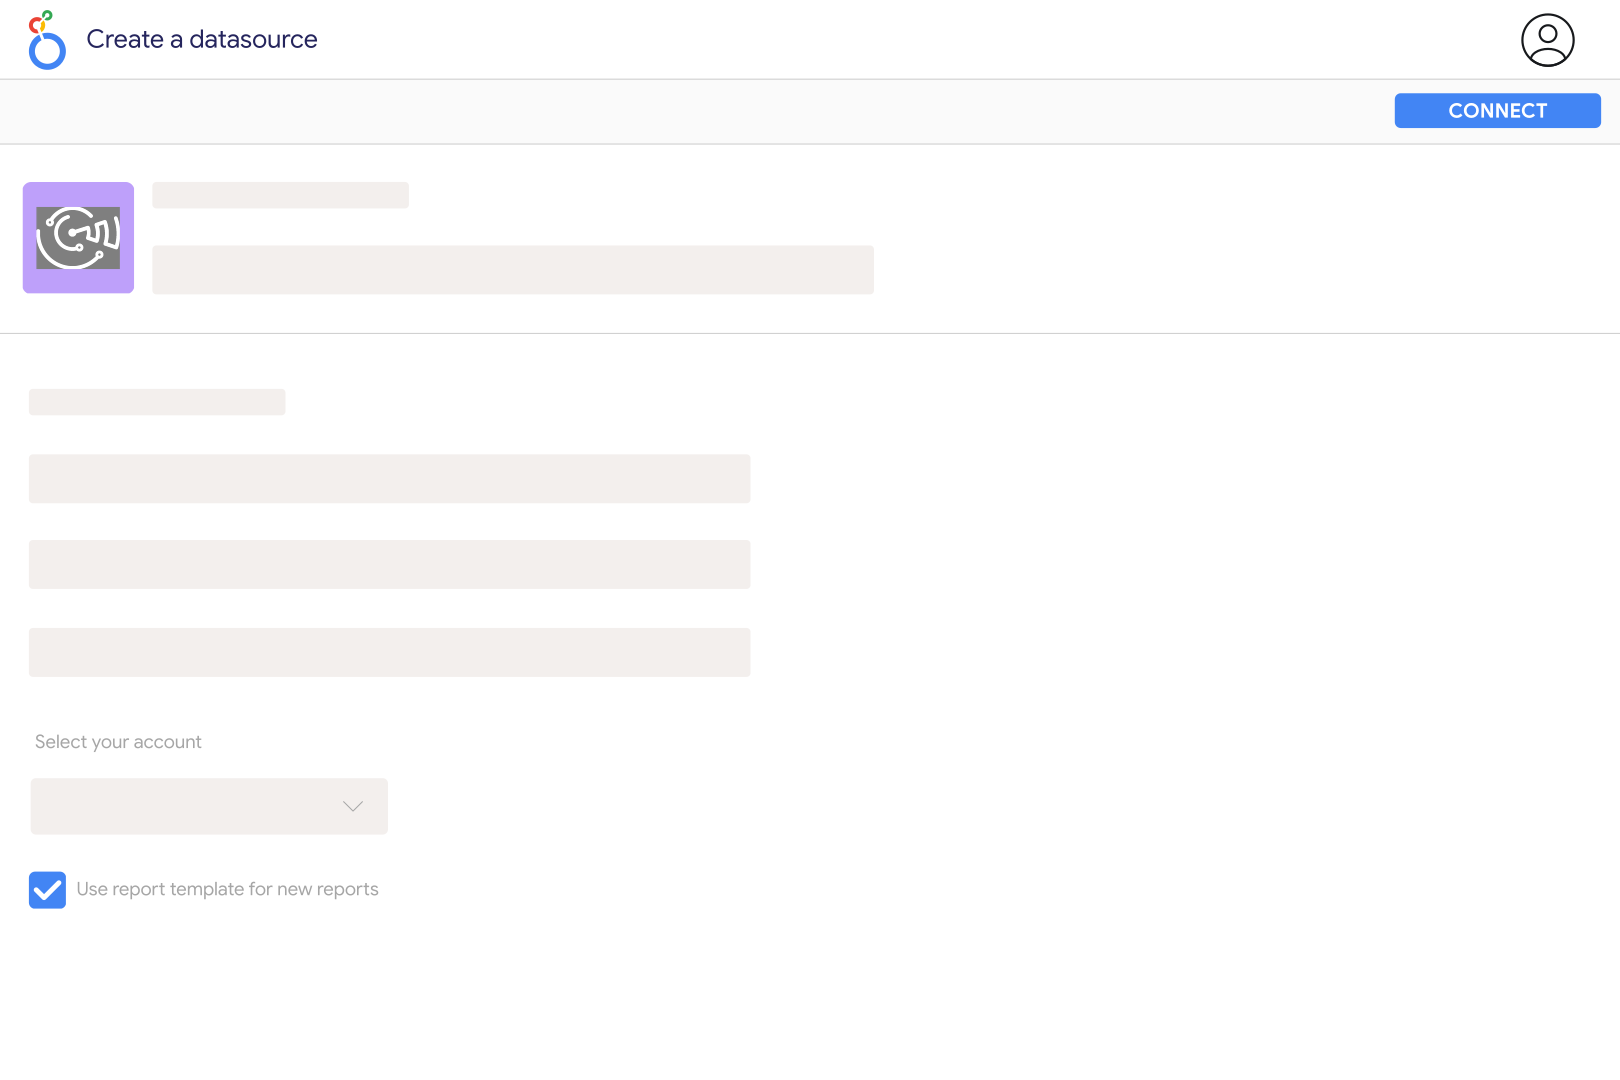
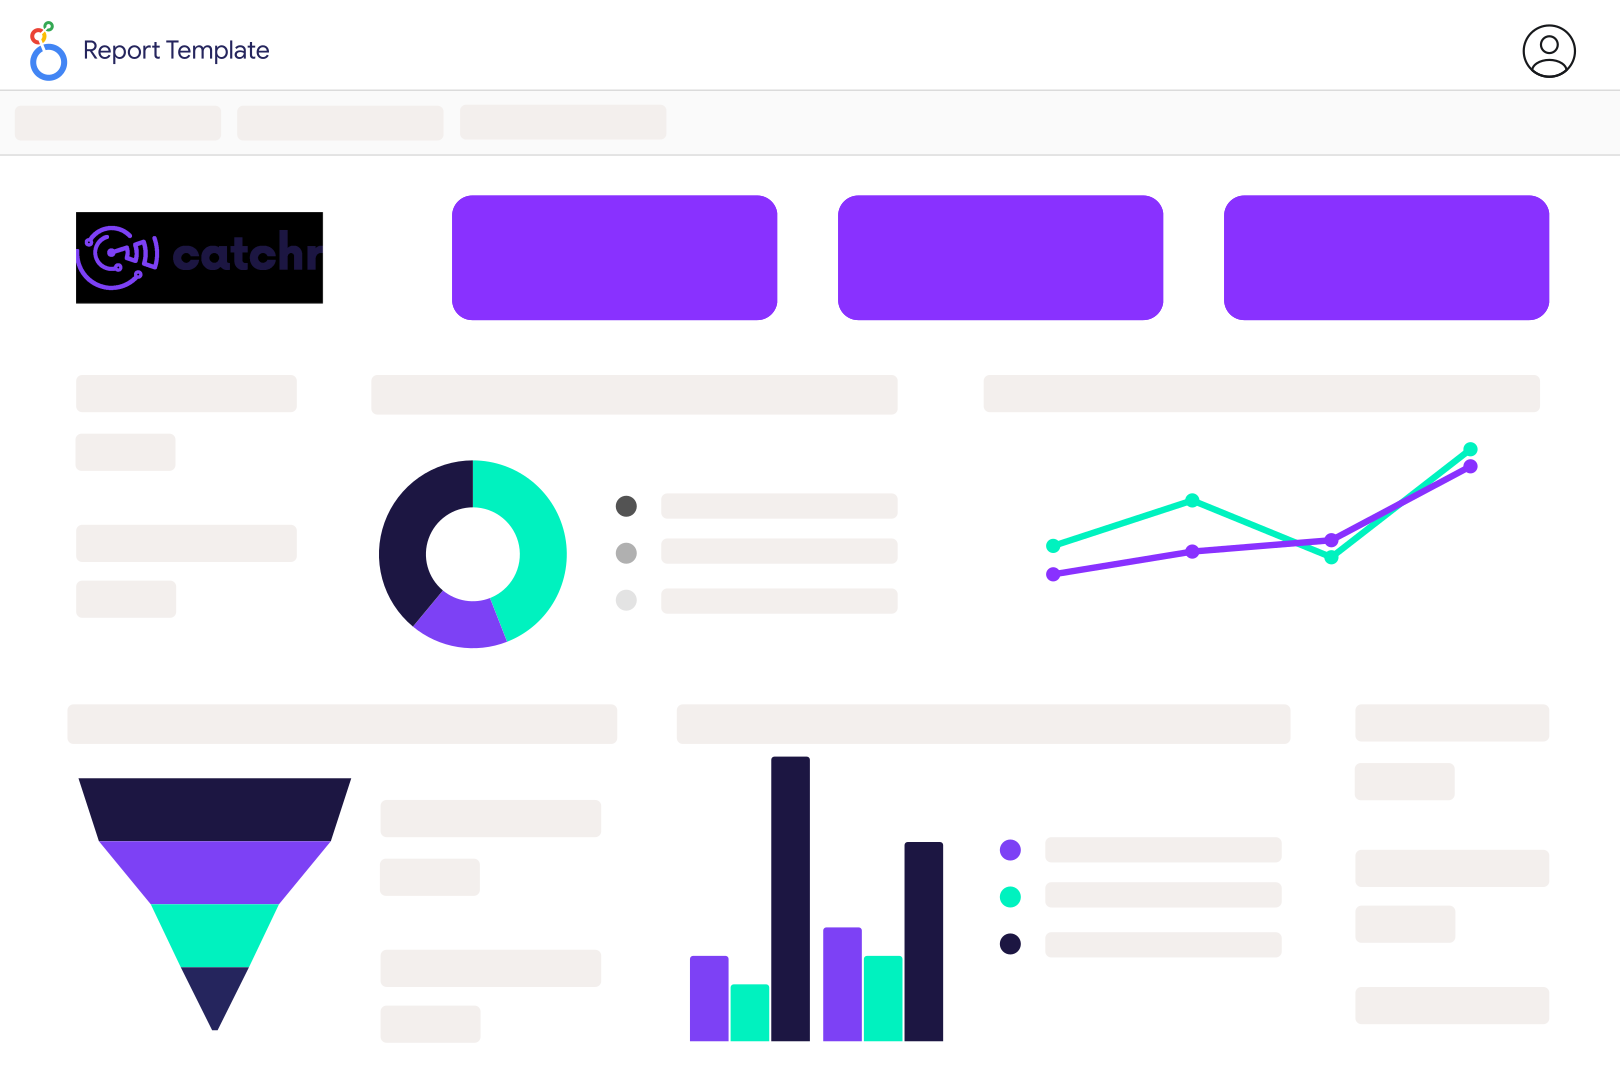
Generate a MailerLite API token and use it to add your account to Catchr. Then open the Catchr MailerLite connector in Looker Studio, authorize your Google account, select the connected source, and create a report. Add campaign name, sent emails, unique opens, and unique clicks for a first campaign comparison.
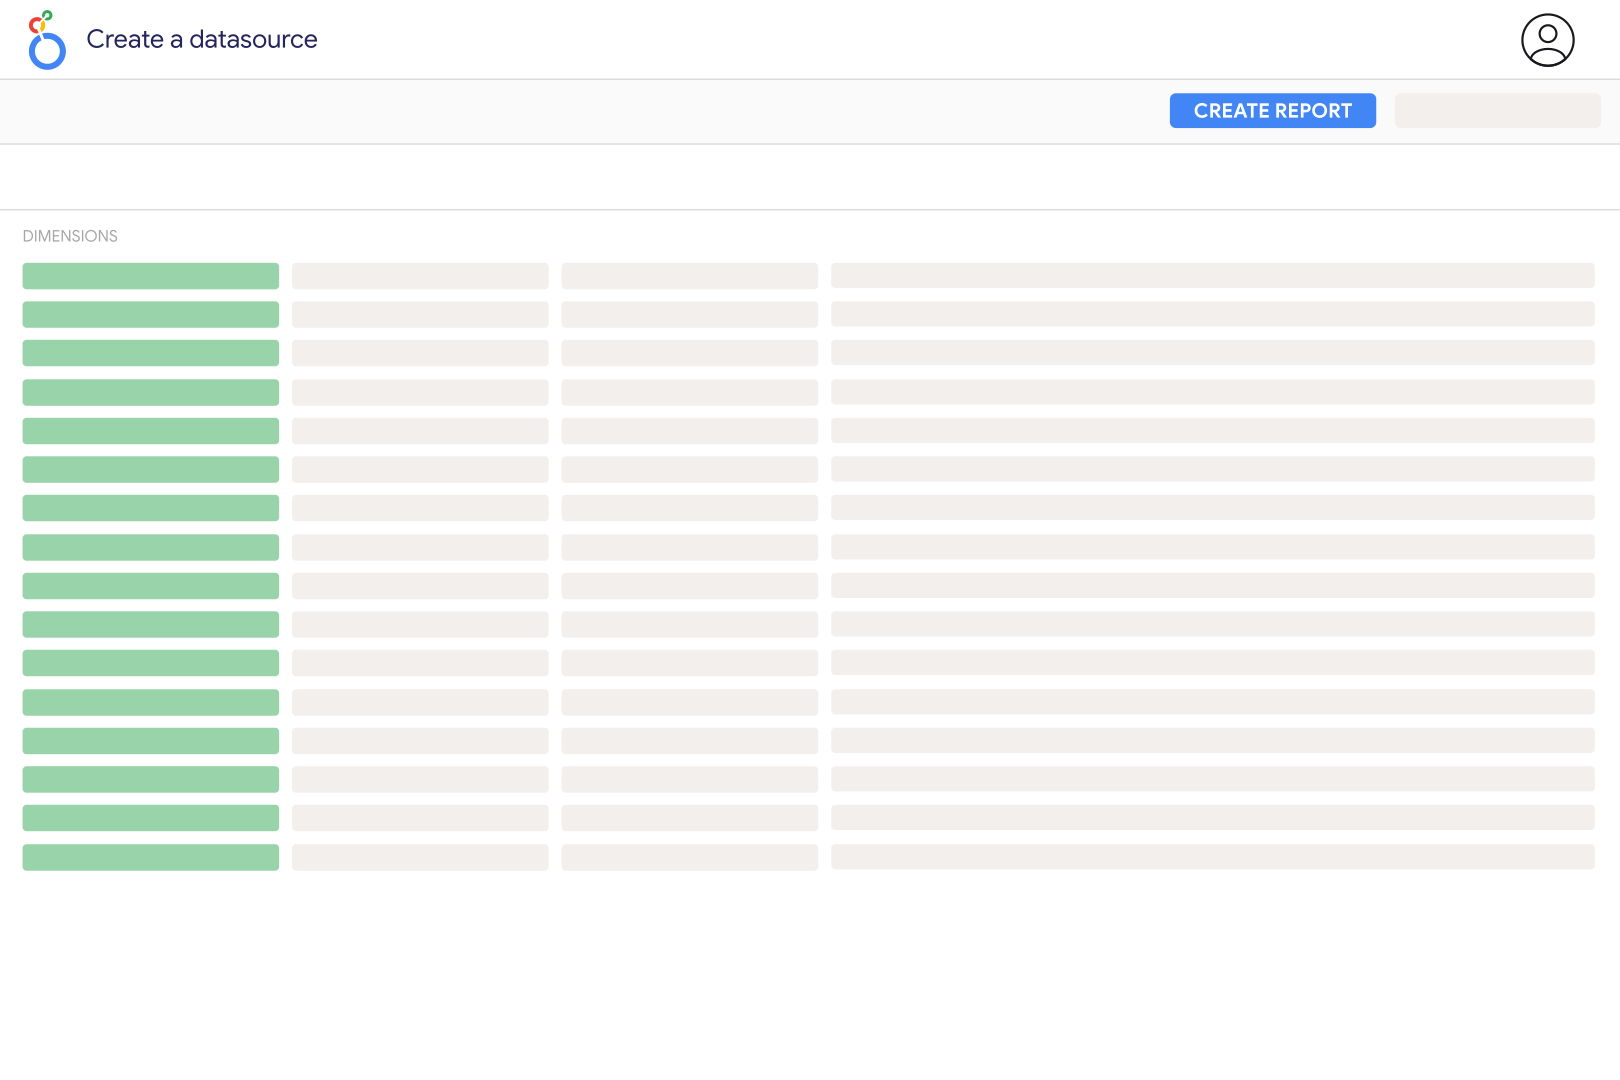
You can report on sends, opens, unique opens, clicks, unique clicks, unsubscribes, spam complaints, and hard and soft bounces. Campaign name, type, status, and scheduling fields provide context for those results. Keep counts alongside rates so that a small campaign with a high percentage does not overshadow a larger campaign with more responses.
Yes. Catchr exposes automation names and IDs, step details, and email statistics such as sends, unique opens, unique clicks, and unsubscribes. Compare email steps within a workflow to identify where engagement falls. Keep automation step statistics separate from newsletter campaign totals so that different reporting levels are not added together.
One recipient can open an email more than once, so total opens can exceed unique opens. The same distinction applies to total and unique clicks. Use the unique metric when comparing how many recipients interacted with each send, and do not add campaign-level unique counts to estimate a distinct audience across several emails.
Use the numeric rate fields and format them as percentages in Looker Studio. MailerLite returns numeric fractions, so 0.25 represents 25%, not 0.25%. Do not sum rates across campaigns. For an overall rate, calculate it from the appropriate summed counts and denominator, using a consistent definition for every campaign.
First check the campaign status and whether it has actually been sent. A draft or scheduled campaign is not comparable with a completed send, and an email with open tracking disabled cannot provide the same open statistics. Also verify the account, date field, and filters used in the chart before treating a blank metric as zero performance.
Yes. Use a separate GA4 data source to compare email clicks with website sessions and key events. Tag email links consistently and align the campaign labels and dates before blending data. MailerLite counts email interactions, while GA4 measures tracked activity on your site, so a one-to-one match is not expected.
Our team is always here to answer any questions you may have about our data connector.









