
Starter
For freelancers and small teams.
$ 24 /mo
Billed monthly · cancel anytime
Platforms3
Accounts10


Used by the world's leading companies








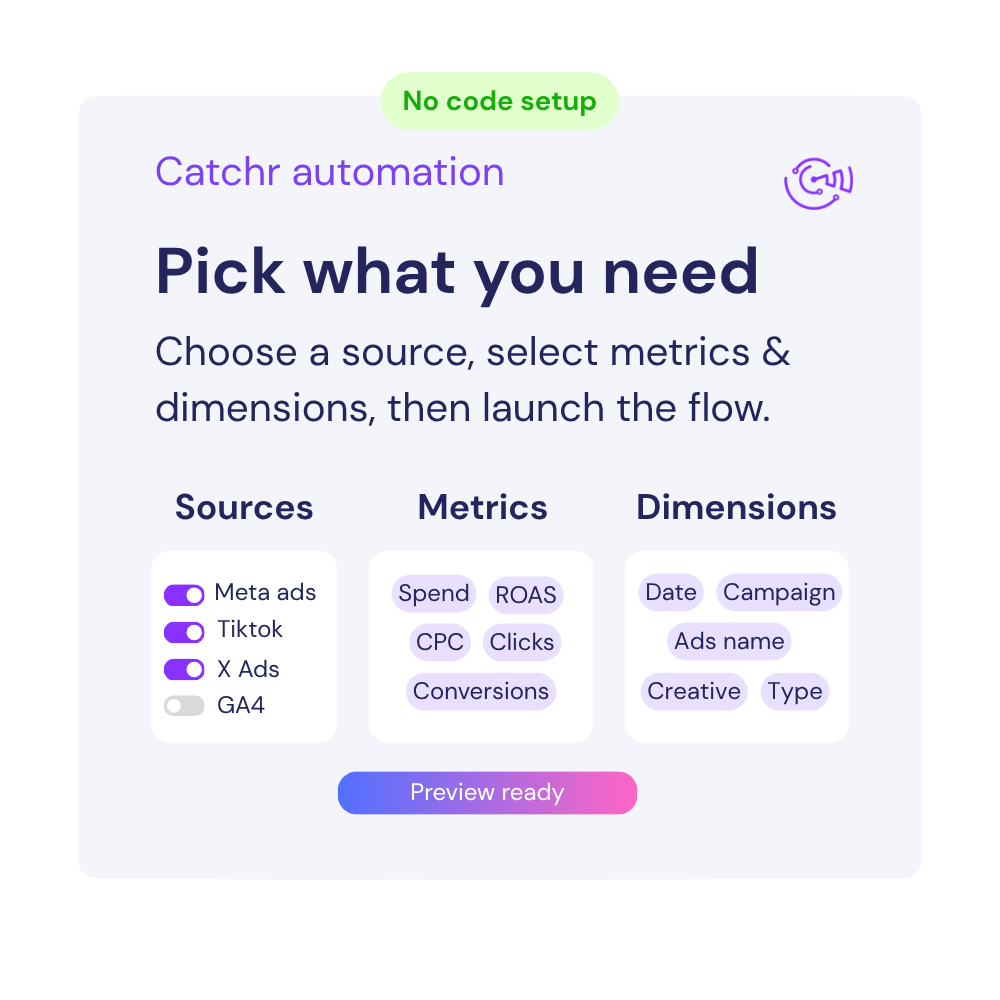
Available metrics
Available dimensions


What our customers say about us.
After three years of use, Catchr has become essential for both our teams and our clients. So far, it has been our best solution for compiling and analyzing data from different advertising platforms. It’s easy to set up, and the customer service is responsive and excellent.

With Catchr’s automated API, we can finally collect and centralize all advertising data, connect it with booking information, and calculate the real ROAS for our restaurant clients. It gives them full visibility, more autonomy, and the ability to optimize campaigns to maximize ROI.

The solution is a real game changer, providing optimal time savings for our data reporting. The major strength of the solution is their highly responsive and professional support.

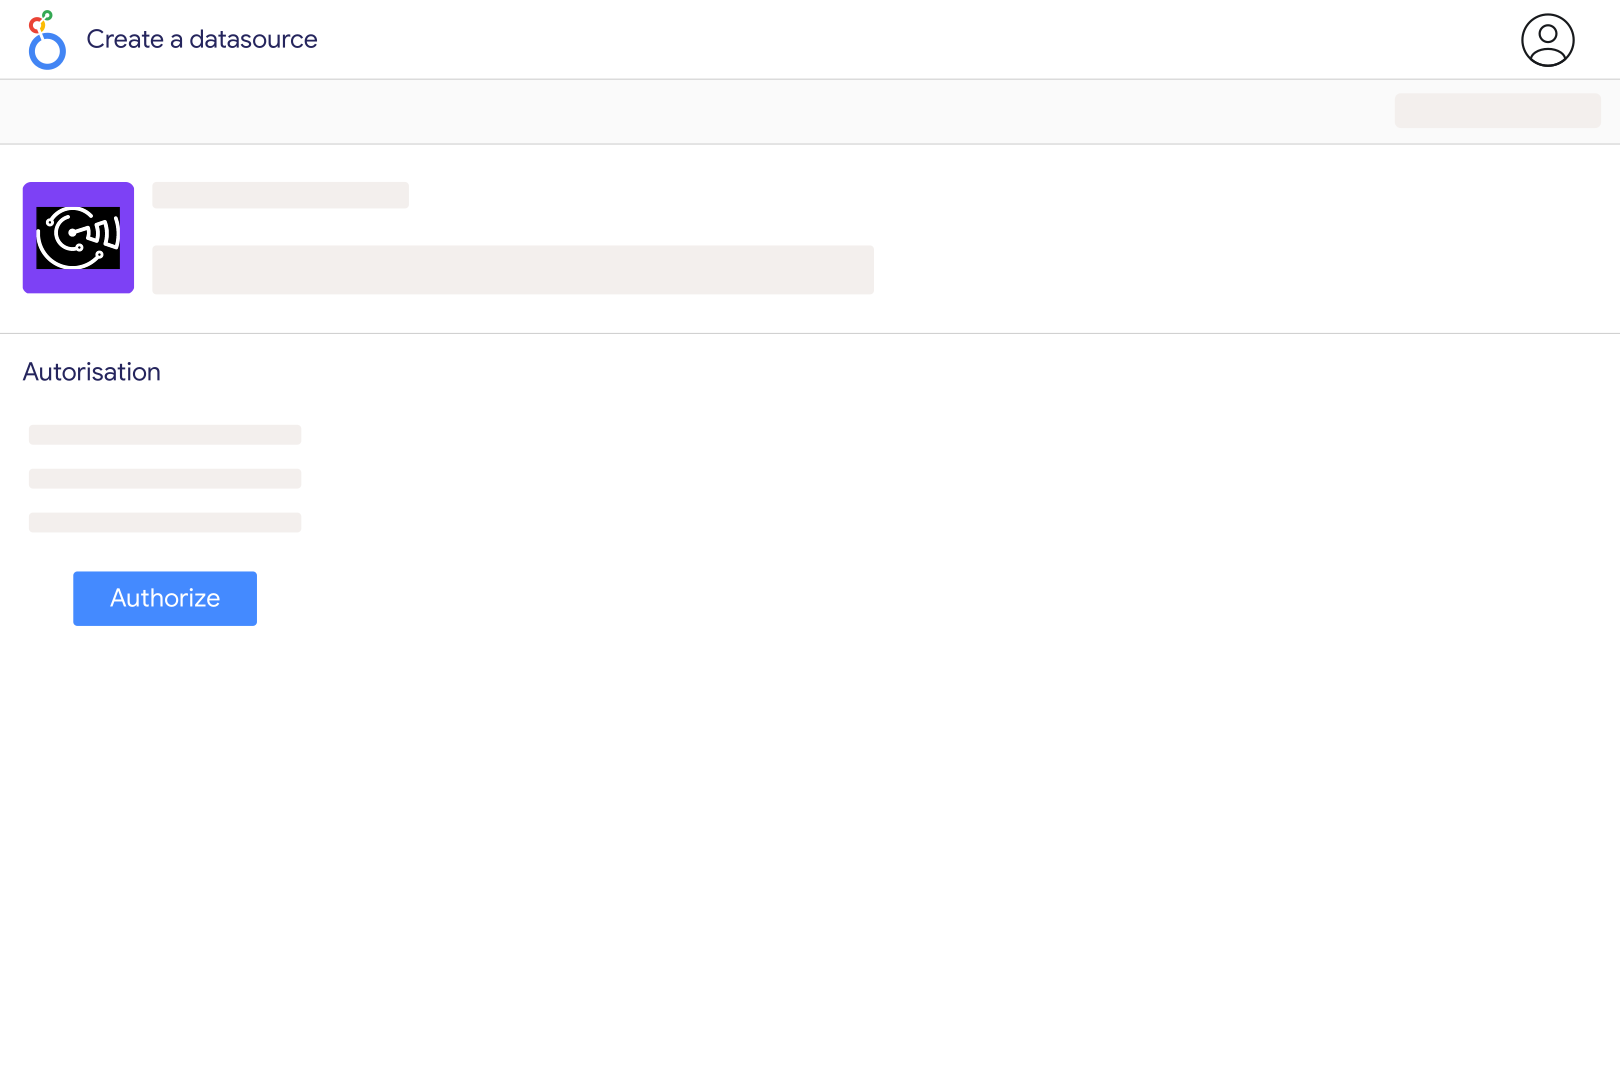
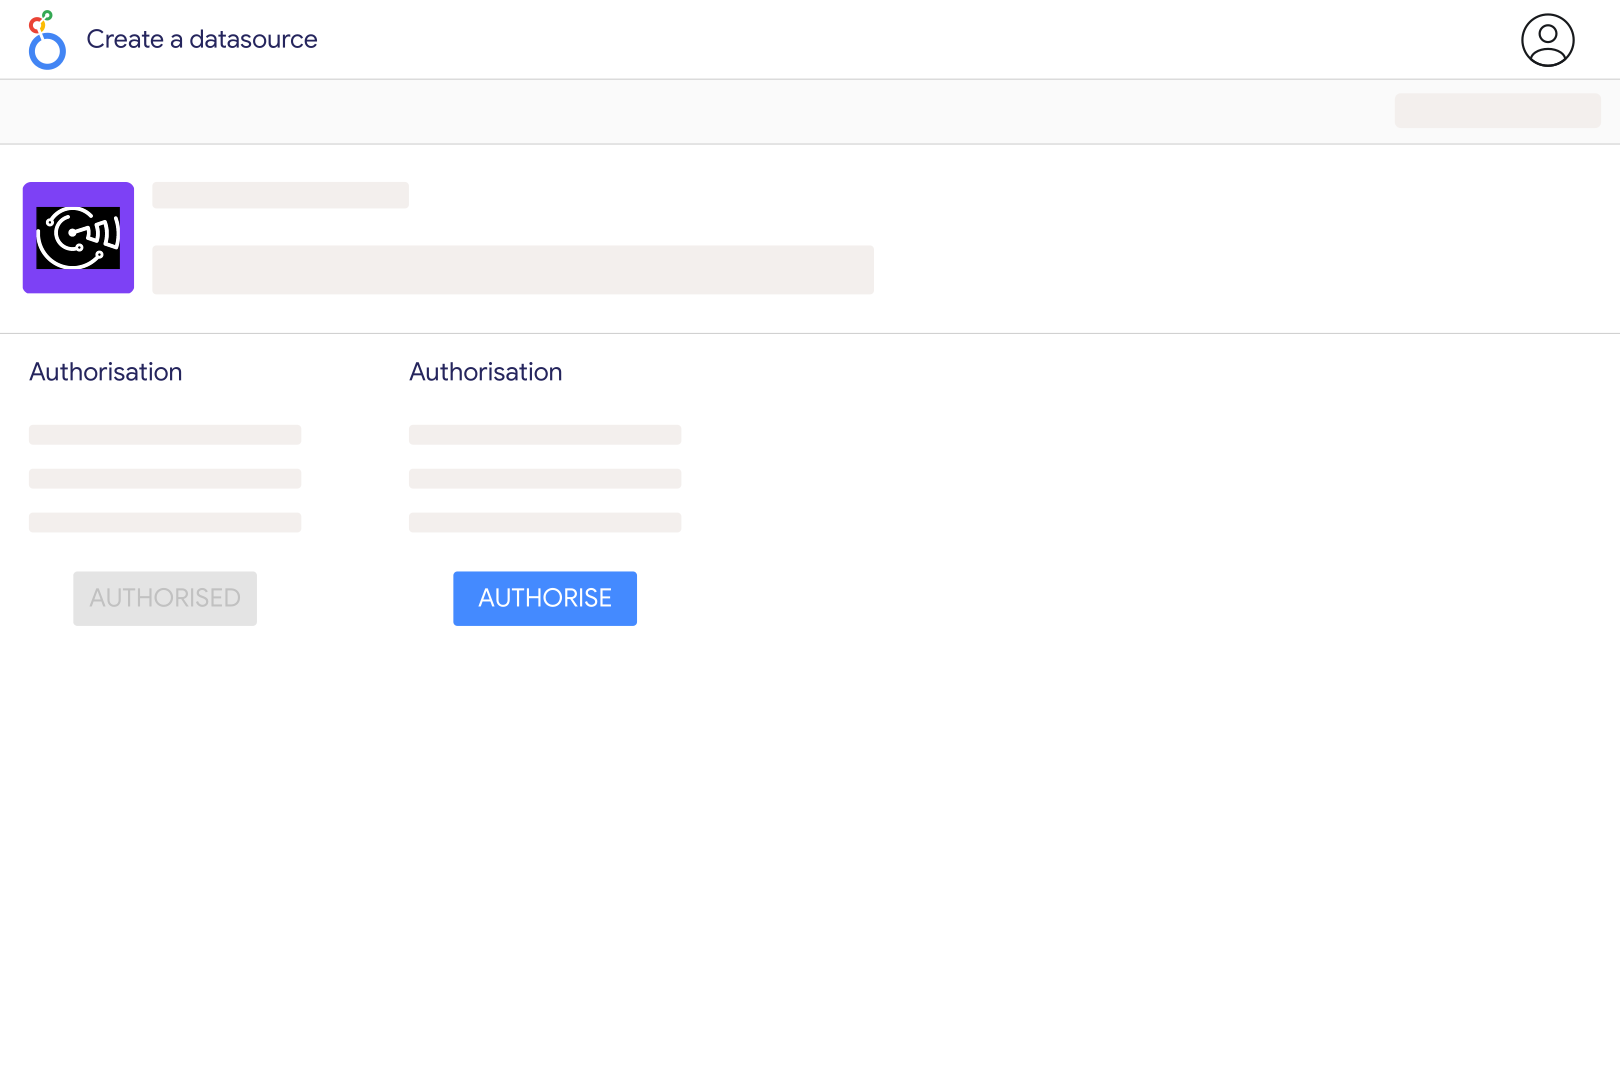
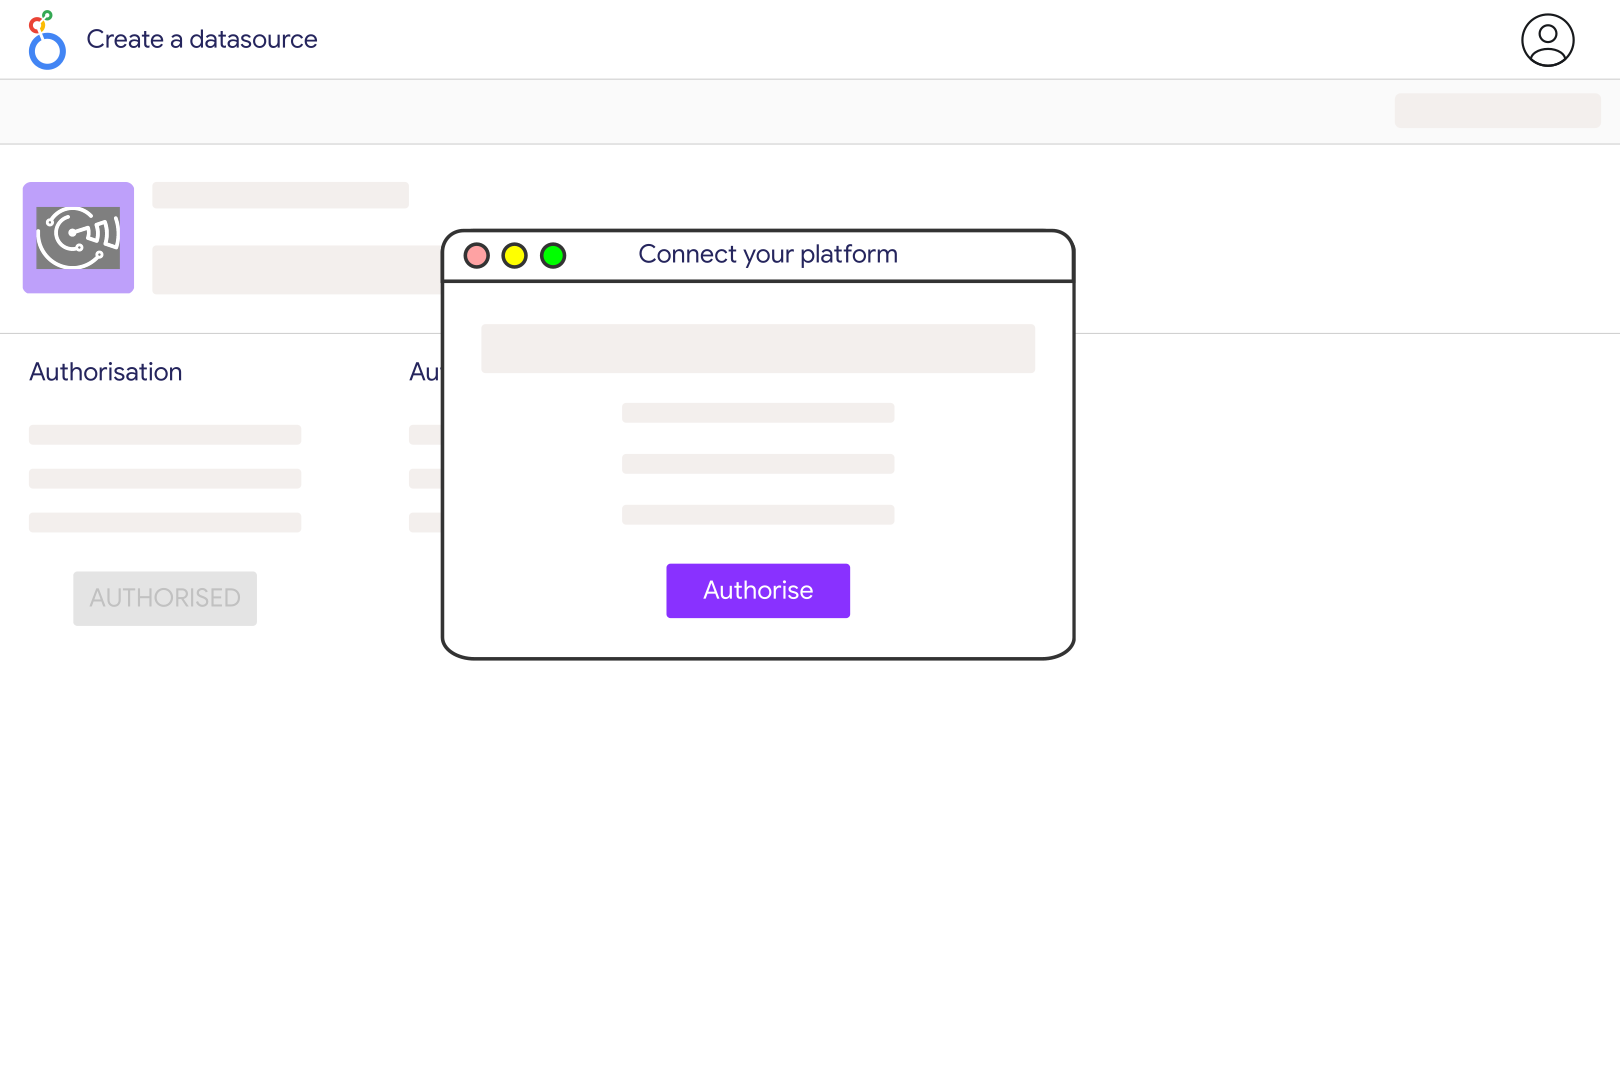
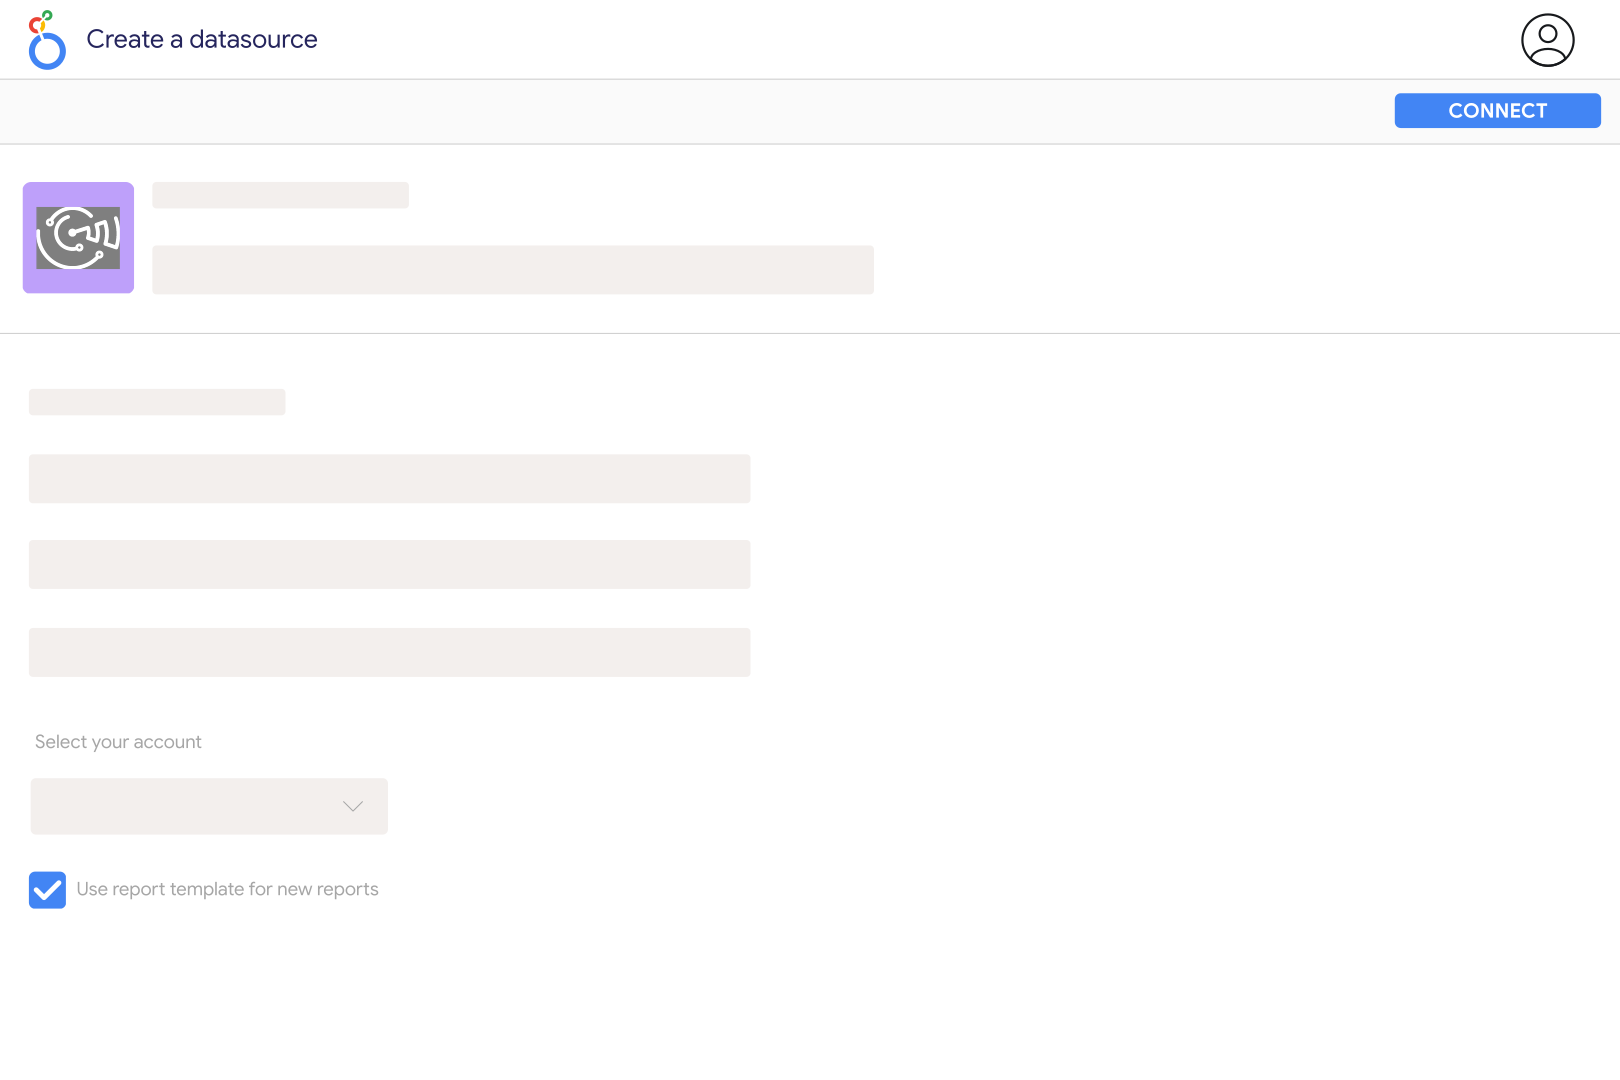
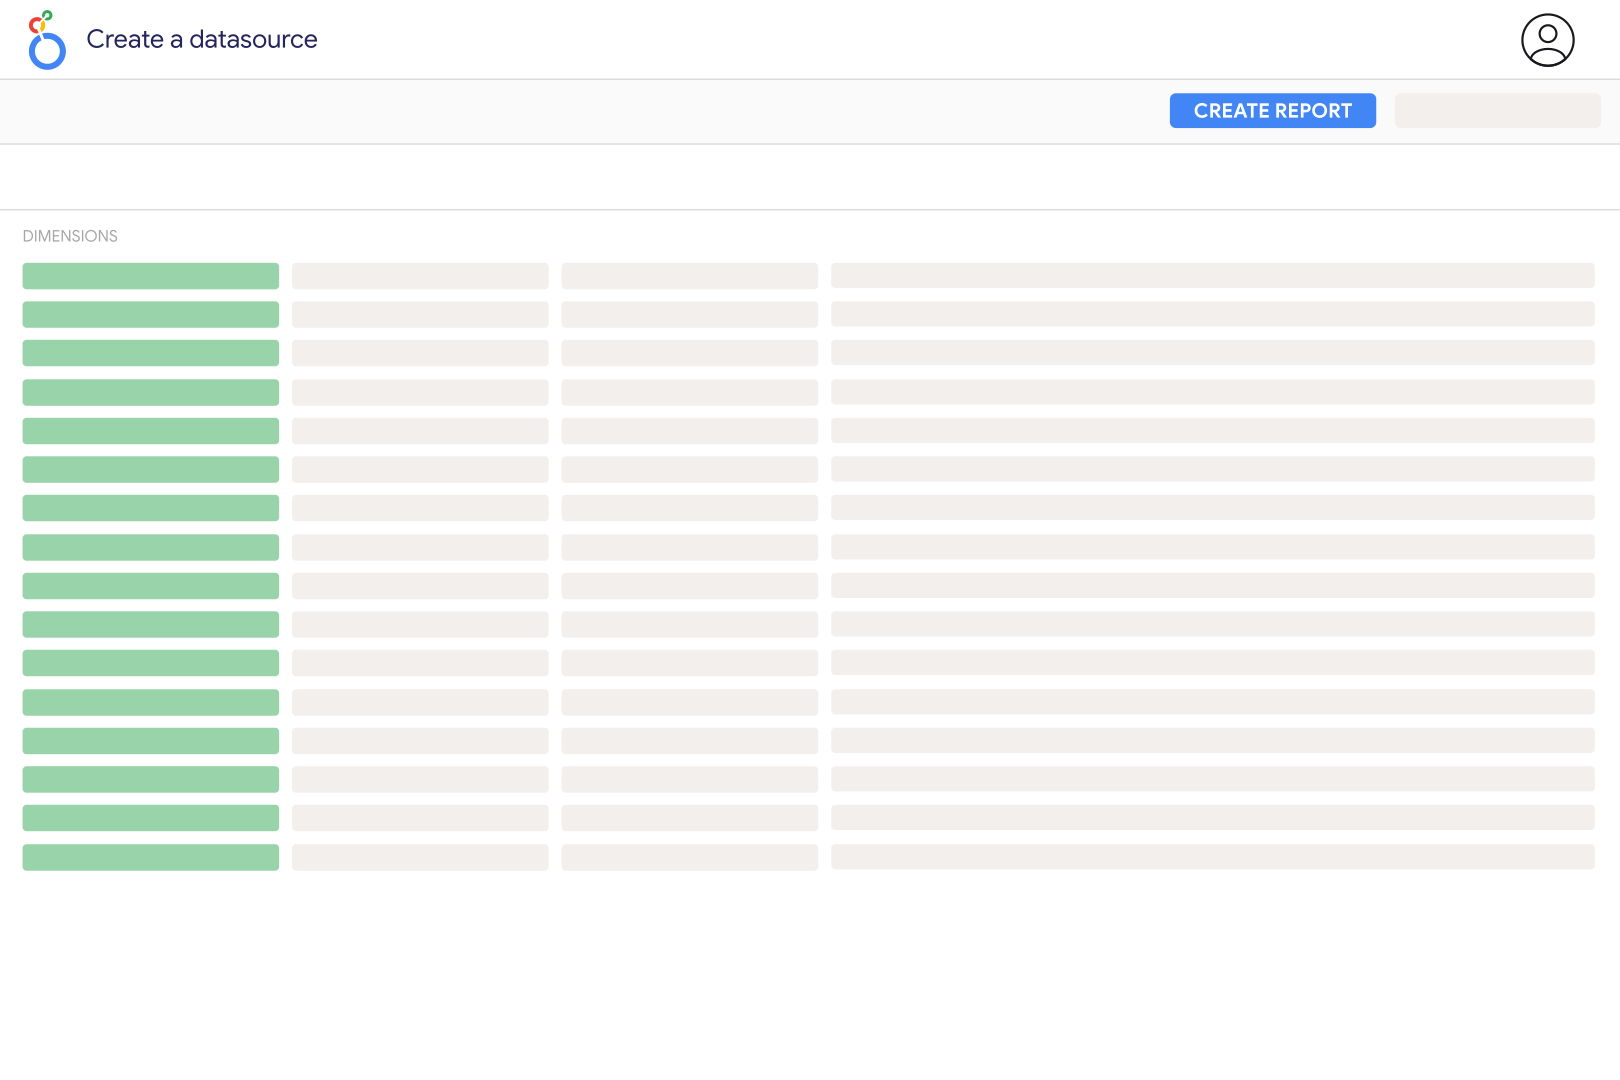
Follow Catchr’s Apple Search Ads setup instructions to register the supplied public key in your Apple Ads API settings. Enter the Client ID, Team ID, and Key ID in Catchr. Then open its Apple Search Ads connector in Looker Studio, authorize Google, select your account, and create a campaign report.
Catchr exposes impressions, taps, spend, tap-through rate, cost per tap, cost per acquisition, and download metrics. Campaign, ad-group, ad, and keyword information helps explain performance. Use compatible fields for the reporting level you choose and keep the spend currency visible when comparing accounts.
Installs can include both new downloads and redownloads. New-download metrics isolate downloads classified as new, while redownload metrics describe users downloading an app they previously installed. Use the metric appropriate to acquisition or re-engagement, and keep the attribution basis consistent across the comparison.
Total installs include tap-through and view-through downloads, while the tap-through measure covers installs attributed to ad taps. Catchr also exposes view-install fields. Do not add total installs to its component metrics, and match the same install definition when comparing cost per install with the Apple Ads interface.
Catchr exposes keyword reporting fields and the ad-group setting that indicates whether Search Match is enabled. Use these to organize keyword and ad-group analysis, but do not assume that a setting proves which search query produced every install. Keep campaign and ad-group IDs in your analysis when names are reused.
Divide total spend by total taps, using a consistent currency. An unweighted average of campaign-level cost-per-tap values gives small campaigns the same influence as large ones. Apply the same principle to install costs: choose the intended install metric and divide the corresponding spend by that total.
Yes. Add App Store Connect to compare advertising delivery with broader app performance. Align apps, countries, dates, and download definitions. App-store totals include activity beyond paid acquisition, so they should not be expected to equal ad-attributed installs.
Our team is always here to answer any questions you may have about our data connector.









