
Starter
For freelancers and small teams.
$ 24 /mo
Billed monthly · cancel anytime
Platforms3
Accounts10


Used by the world's leading companies









Available metrics
Available dimensions


What our customers say about us.
After three years of use, Catchr has become essential for both our teams and our clients. So far, it has been our best solution for compiling and analyzing data from different advertising platforms. It’s easy to set up, and the customer service is responsive and excellent.

With Catchr’s automated API, we can finally collect and centralize all advertising data, connect it with booking information, and calculate the real ROAS for our restaurant clients. It gives them full visibility, more autonomy, and the ability to optimize campaigns to maximize ROI.

The solution is a real game changer, providing optimal time savings for our data reporting. The major strength of the solution is their highly responsive and professional support.

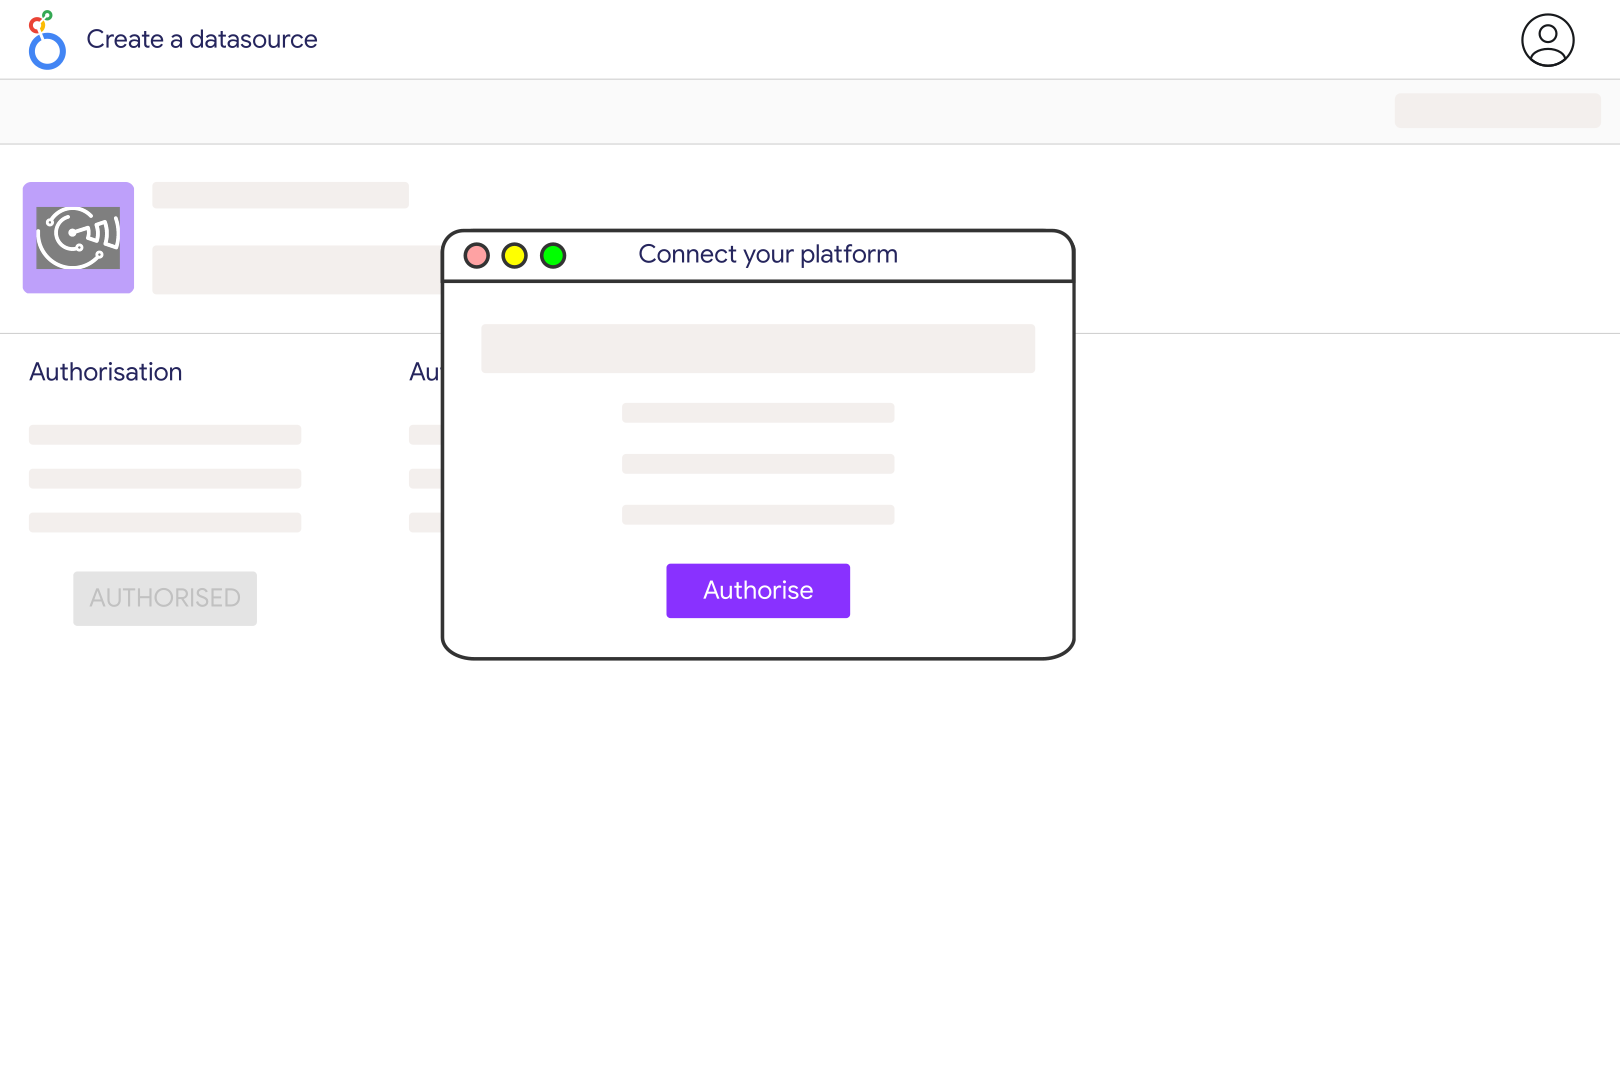
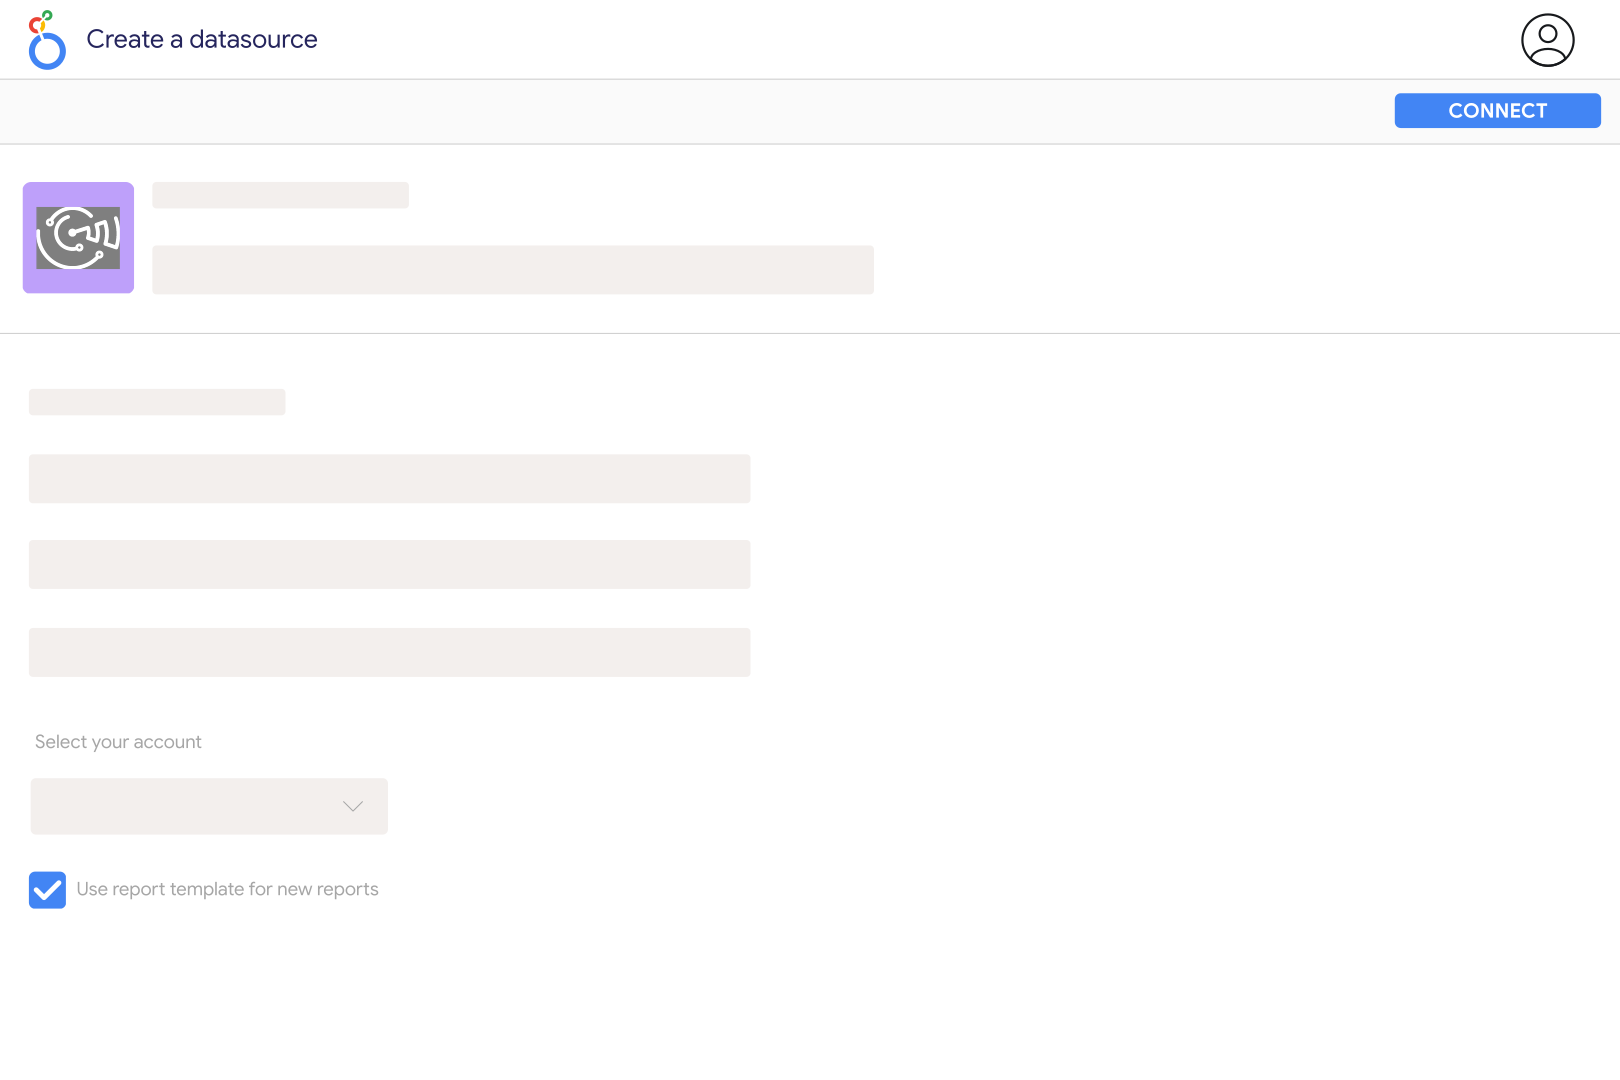
Configure your Amplitude project in Catchr and select it in the Catchr Looker Studio connector. Build a table of event types and timestamps before adding user or device breakdowns. Use a known event from your application to confirm that the project and reporting period are correct.
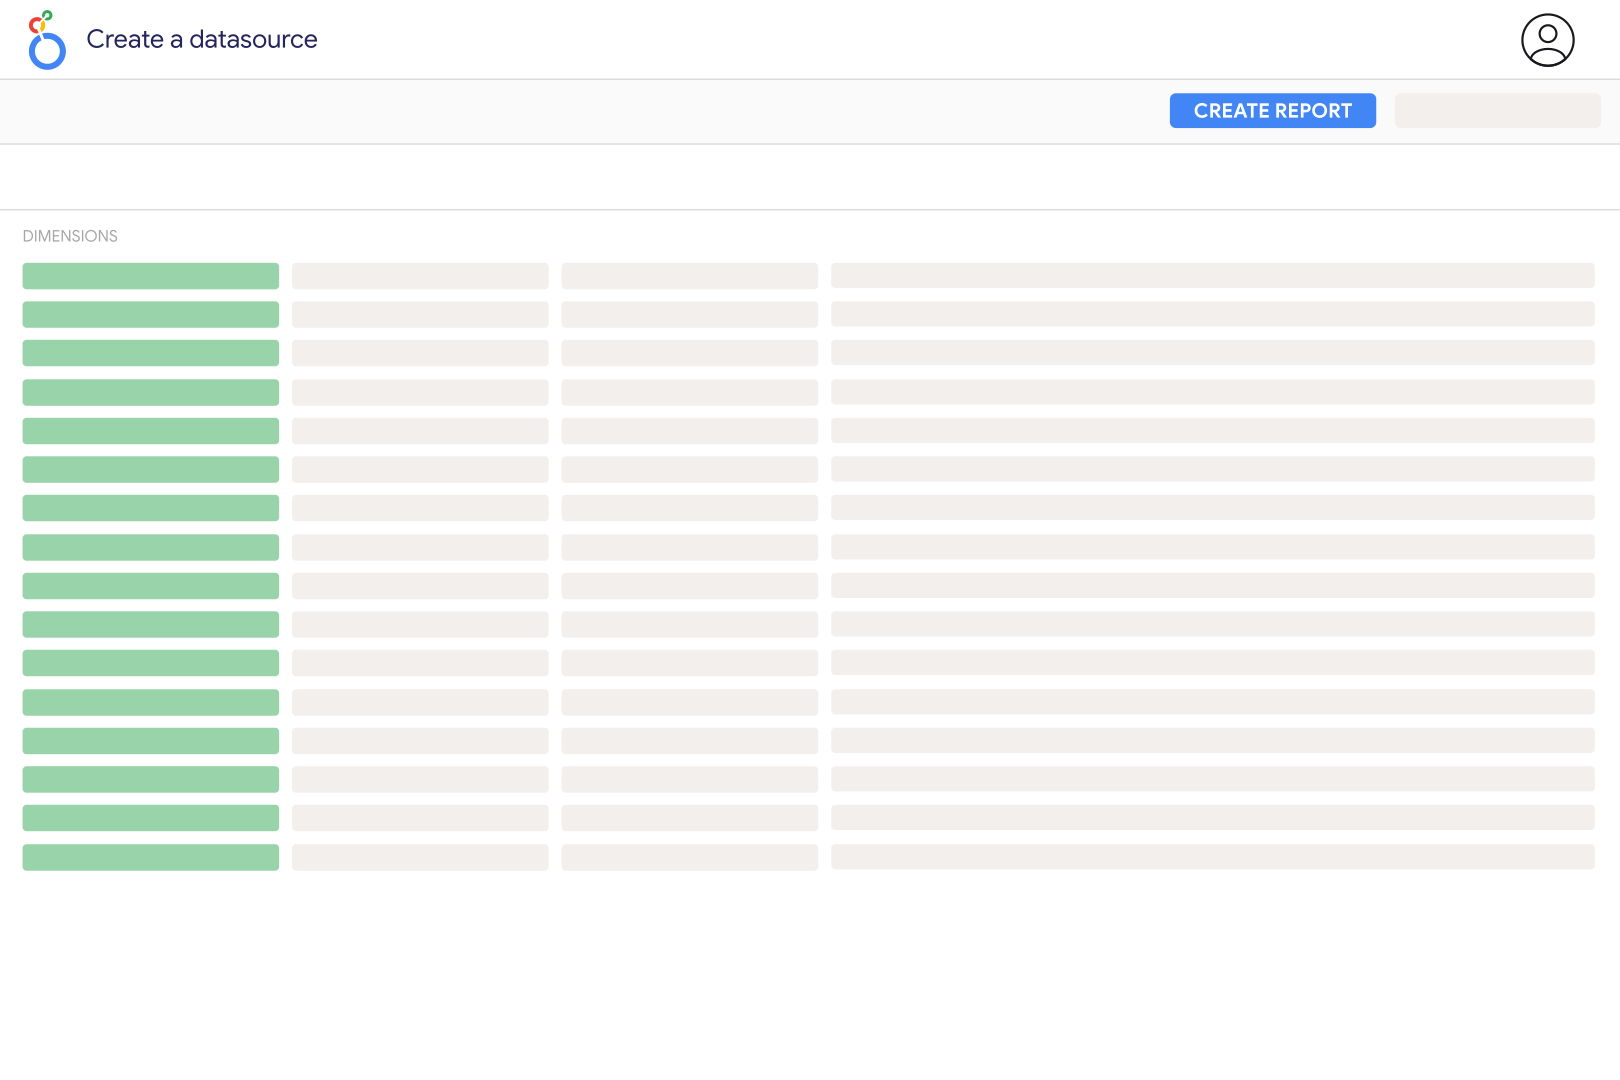
Catchr's catalog includes event type, event time, user ID, device ID, session ID, platform, app version and location fields. Event and user properties are also available as structured values. This gives you event-level reporting data rather than an automatic import of Amplitude's saved charts.
An event can occur on a device before it reaches Amplitude's servers. Amplitude exposes separate event and upload timestamps, and its Export API selects data by server upload time. Keep those meanings distinct when reconciling a report, especially after offline activity or a historical backfill.
Not always. Amplitude documents a delay before newly received events become available through its Export API. Recent exported results can therefore lag the platform's reporting interface. Treat the newest period as provisional instead of assuming that a missing event indicates a tracking failure.
Yes, if you define the qualifying events and identity rule first. Count users across the full reporting period rather than adding daily unique counts. Anonymous device IDs and logged-in user IDs can represent different identity states, so a simple count may differ from Amplitude's resolved user measure.
Event data can support retention analysis, but the calculation must define a starting cohort, a return event and the period in which a user qualifies as retained. A table of daily events is not a retention report by itself. Prepare that cohort logic before visualizing the result.
Yes. Add a subscription source such as RevenueCat to compare product engagement with subscription performance. Align projects, dates and currency. Use a verified identity mapping if you need customer-level analysis rather than only aggregate trends.
Our team is always here to answer any questions you may have about our data connector.









