
Starter
For freelancers and small teams.
$ 24 /mo
Billed monthly · cancel anytime
Platforms3
Accounts10


Used by the world's leading companies








Available metrics
Available dimensions


What our customers say about us.
After three years of use, Catchr has become essential for both our teams and our clients. So far, it has been our best solution for compiling and analyzing data from different advertising platforms. It’s easy to set up, and the customer service is responsive and excellent.

With Catchr’s automated API, we can finally collect and centralize all advertising data, connect it with booking information, and calculate the real ROAS for our restaurant clients. It gives them full visibility, more autonomy, and the ability to optimize campaigns to maximize ROI.

The solution is a real game changer, providing optimal time savings for our data reporting. The major strength of the solution is their highly responsive and professional support.

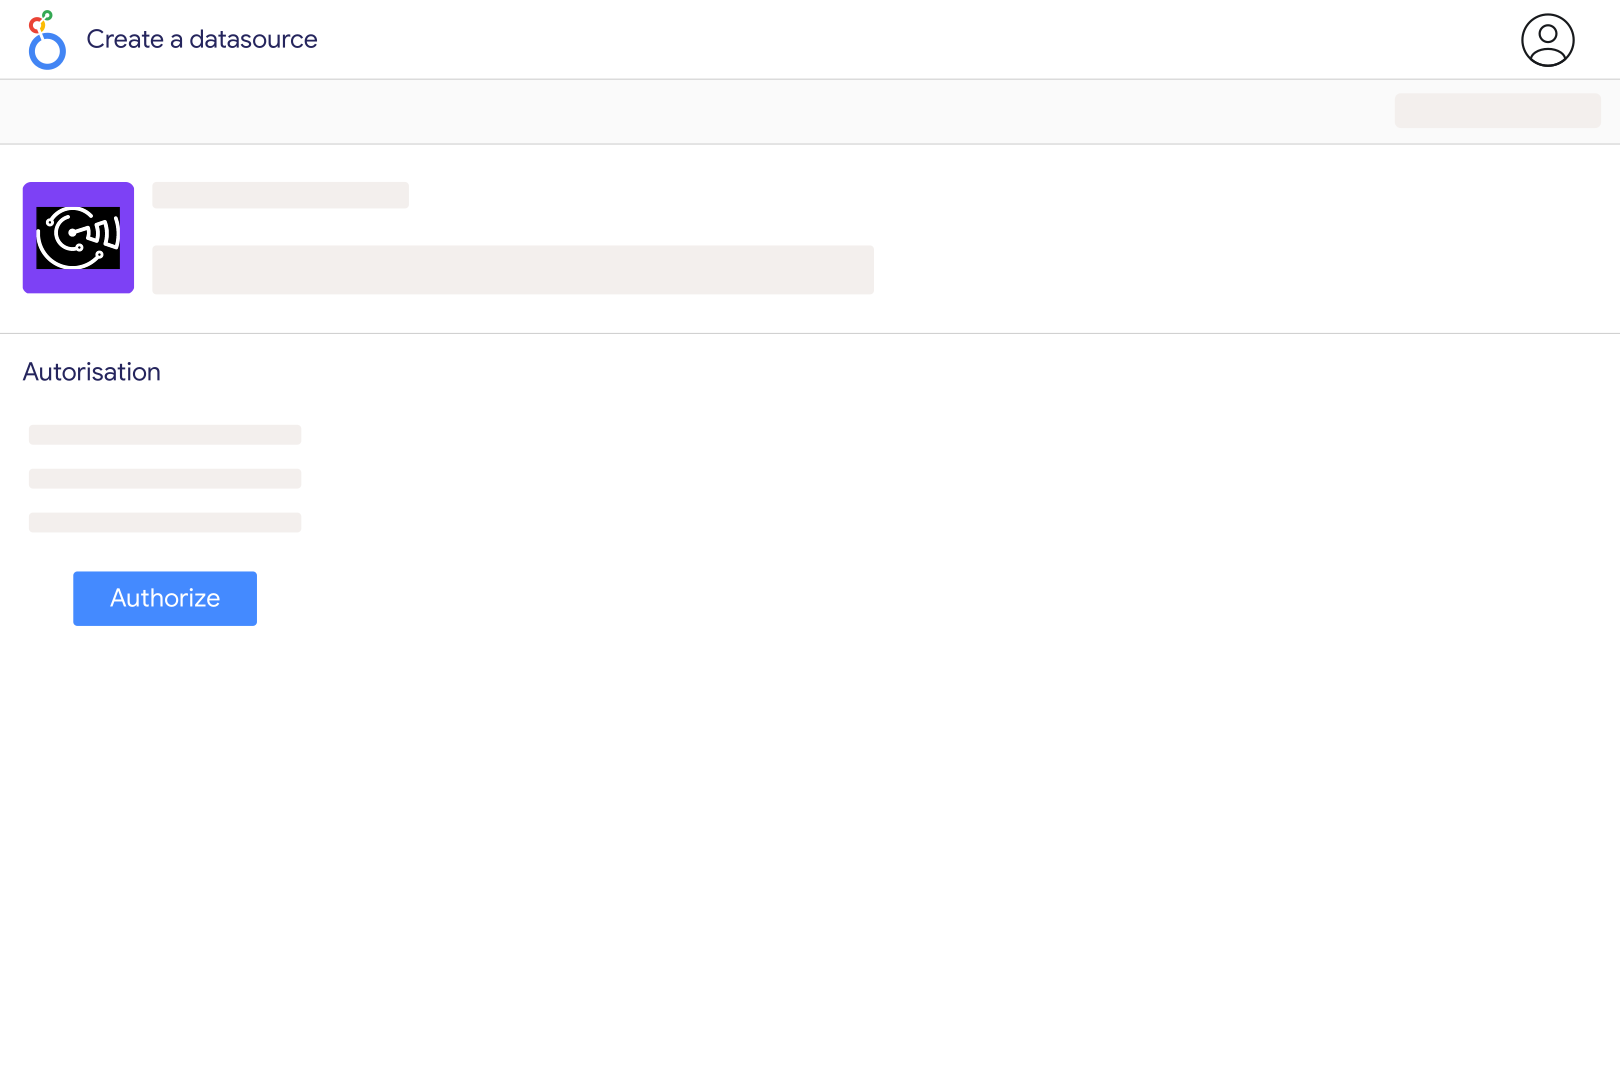
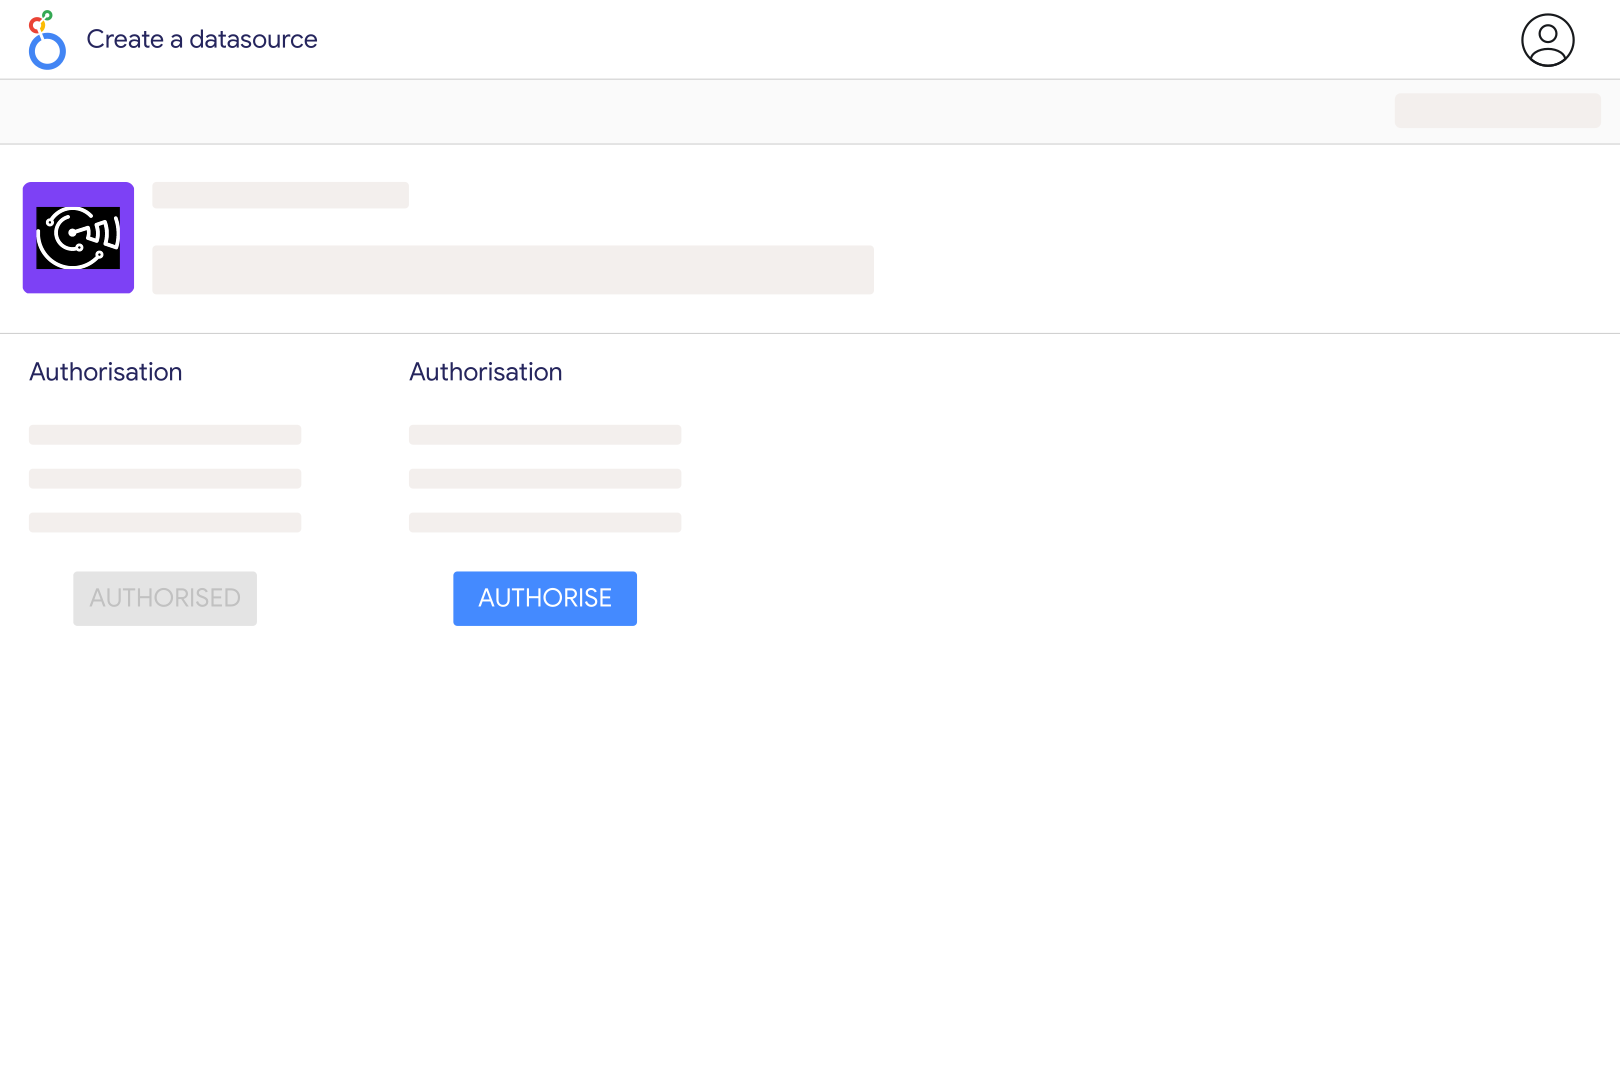
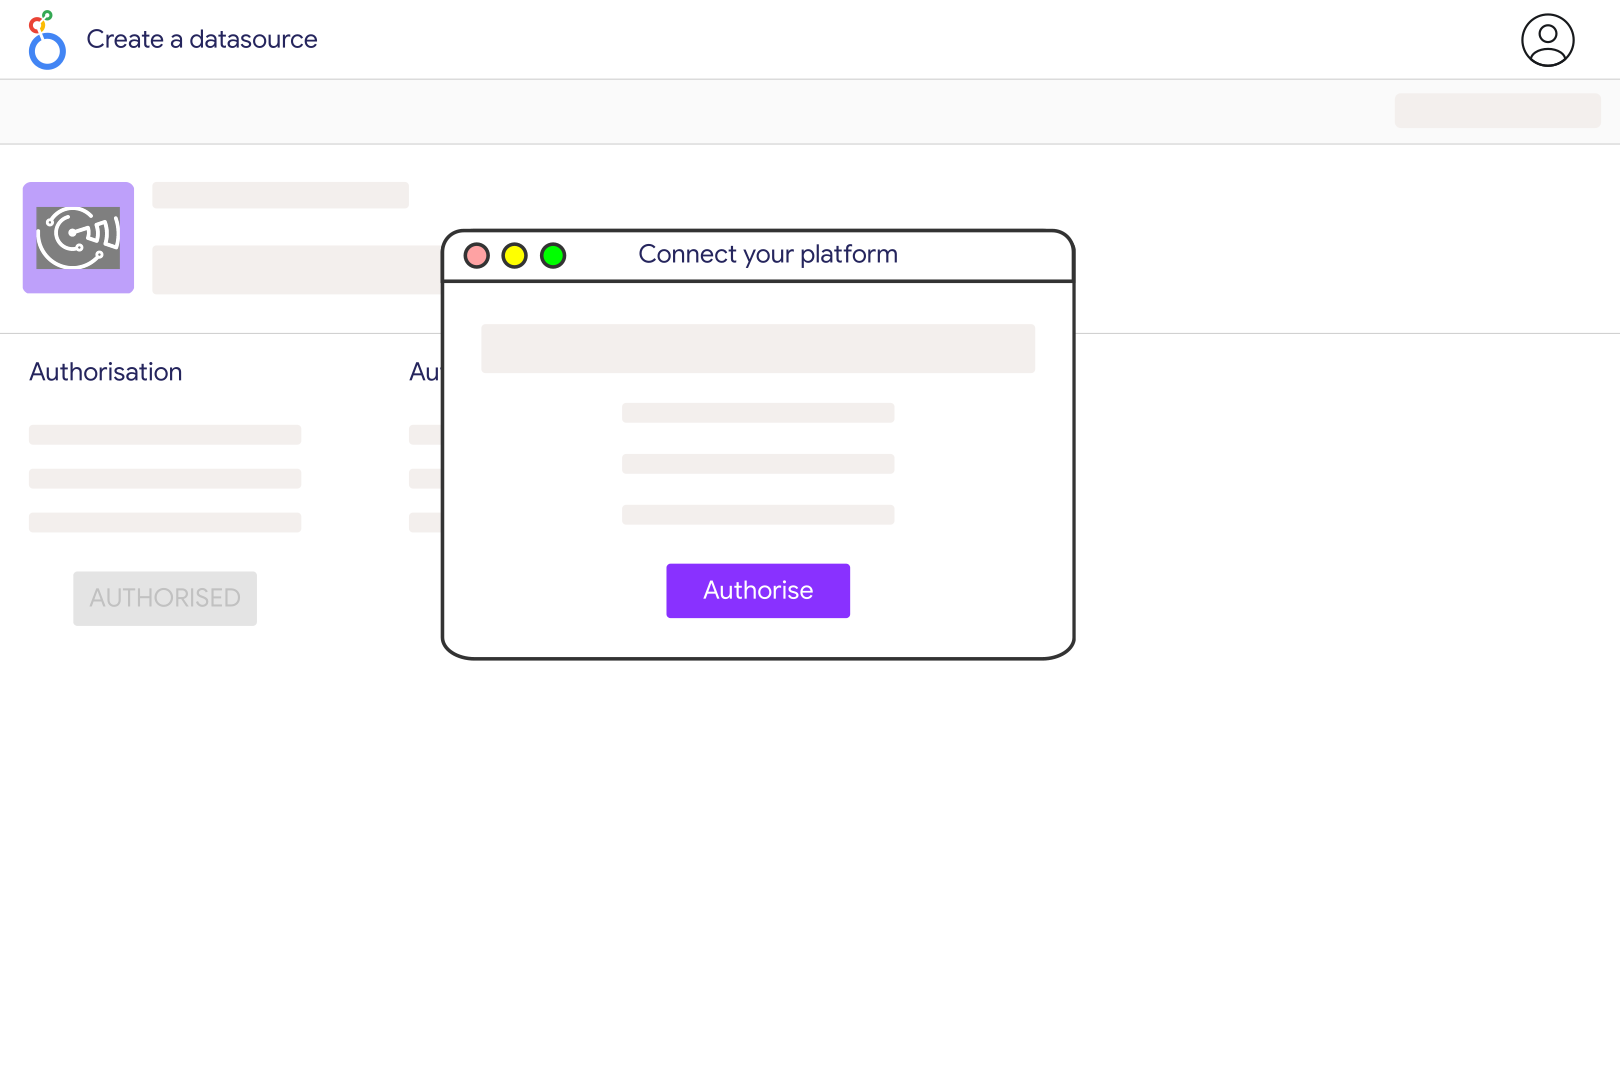
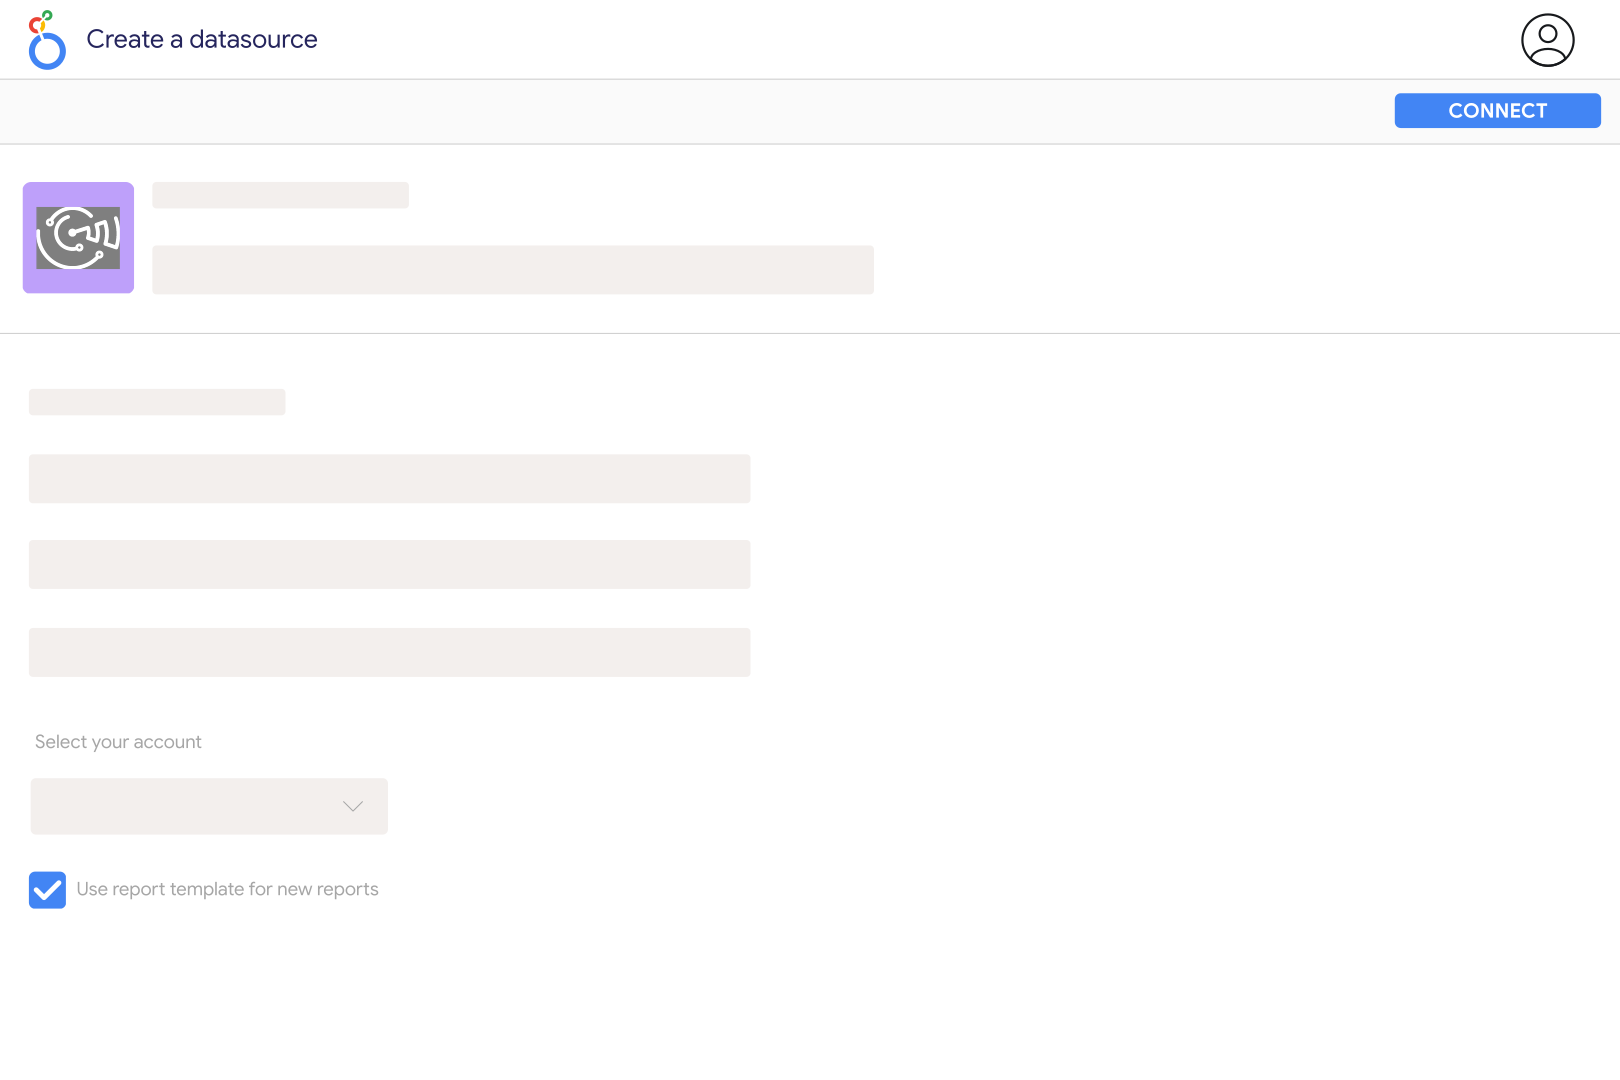
Add Outbrain DSP in Catchr using your DSP API Client ID and Client Secret, then choose an accessible account in the Catchr Looker Studio connector. Create the data source and start with a table of Date, campaign, Impressions, Clicks and Total Spend. These are DSP API credentials, not the username and password for the separate Outbrain advertising connector.
This Catchr source connects to the Zemanta API used by Outbrain DSP, whose current documentation is branded Teads DSP. It is separate from the Outbrain connector and the Teads Ad Manager connector. Match the source to the platform where your account and reporting credentials were issued; similar brand names do not make their connections interchangeable.
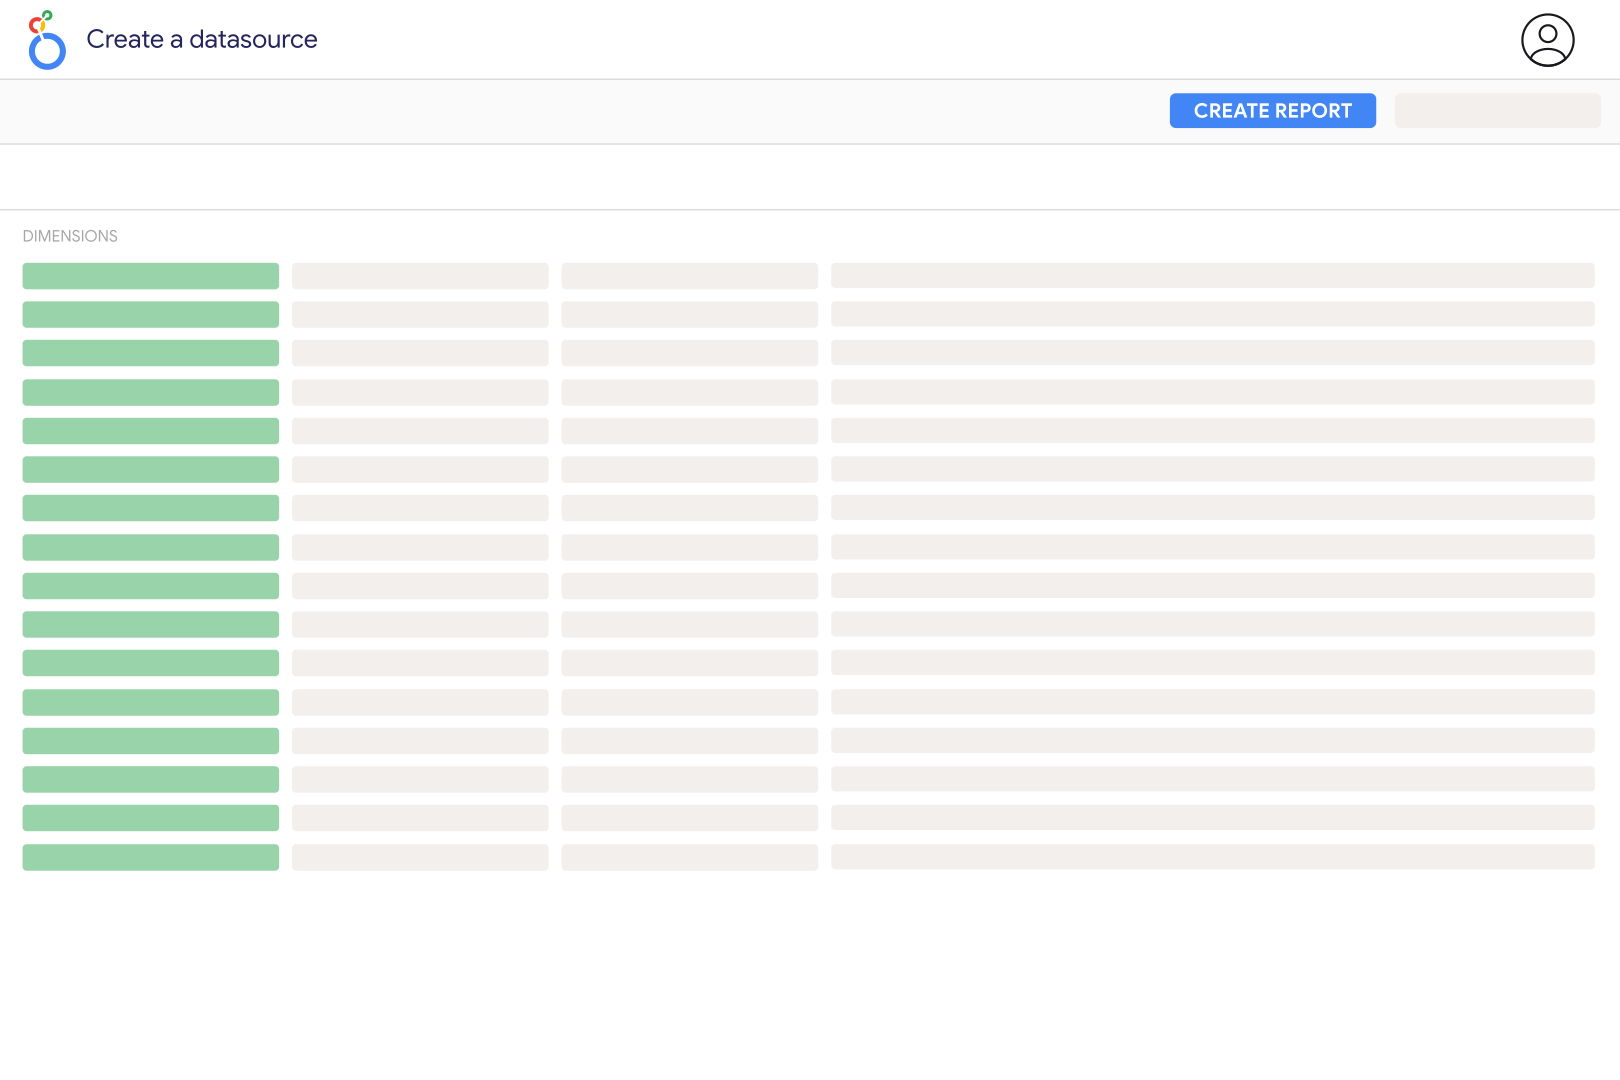
Catchr includes impressions, clicks, media spend, total spend, data cost, license fee, video starts, video completions and viewability fields. Reports can use account, campaign, ad group or content ad levels, with available breakdowns such as publisher, device and country. Start at the reporting level you need and add breakdowns gradually, checking totals against the DSP report with the same selections.
The current Catchr field catalog for this source does not expose conversion counts, CPA or ROAS. Use it for delivery, cost, video and available engagement reporting. To measure business outcomes, add a separately connected analytics source such as GA4 and define how its campaign data matches DSP spend. Those analytics results follow their own attribution rules and do not recreate the DSP's conversion report.
Choose the cost field that matches the figure you use in the DSP interface. Catchr exposes Media Spend, Data Cost, License Fee, Total Spend and Margin separately, so they should not be treated as interchangeable amounts or added together indiscriminately. Use one consistent cost basis when calculating CPC or CPM, and verify currency before combining accounts or other advertising platforms.
The connector excludes visit and site-engagement fields from hourly requests, including Visits, Unique Users, Pageviews, Bounce Rate and Time on Site. Use hourly charts for supported delivery metrics such as impressions, clicks and spend, and assess engagement in a separate report at a supported time level. A blank or zero for an unsupported field should not be interpreted as proof that no visits occurred.
Catchr retrieves generated DSP reports, which can take time to prepare, rather than the platform's separate real-time statistics feed. Looker Studio caching also affects when updated values appear. Recent traffic and post-click engagement may finish processing at different times, so use completed periods for client comparisons and check the dashboard's data freshness before treating a recent drop as a campaign problem.
Our team is always here to answer any questions you may have about our data connector.









