
Starter
For freelancers and small teams.
$ 24 /mo
Billed monthly · cancel anytime
Platforms3
Accounts10


Used by the world's leading companies










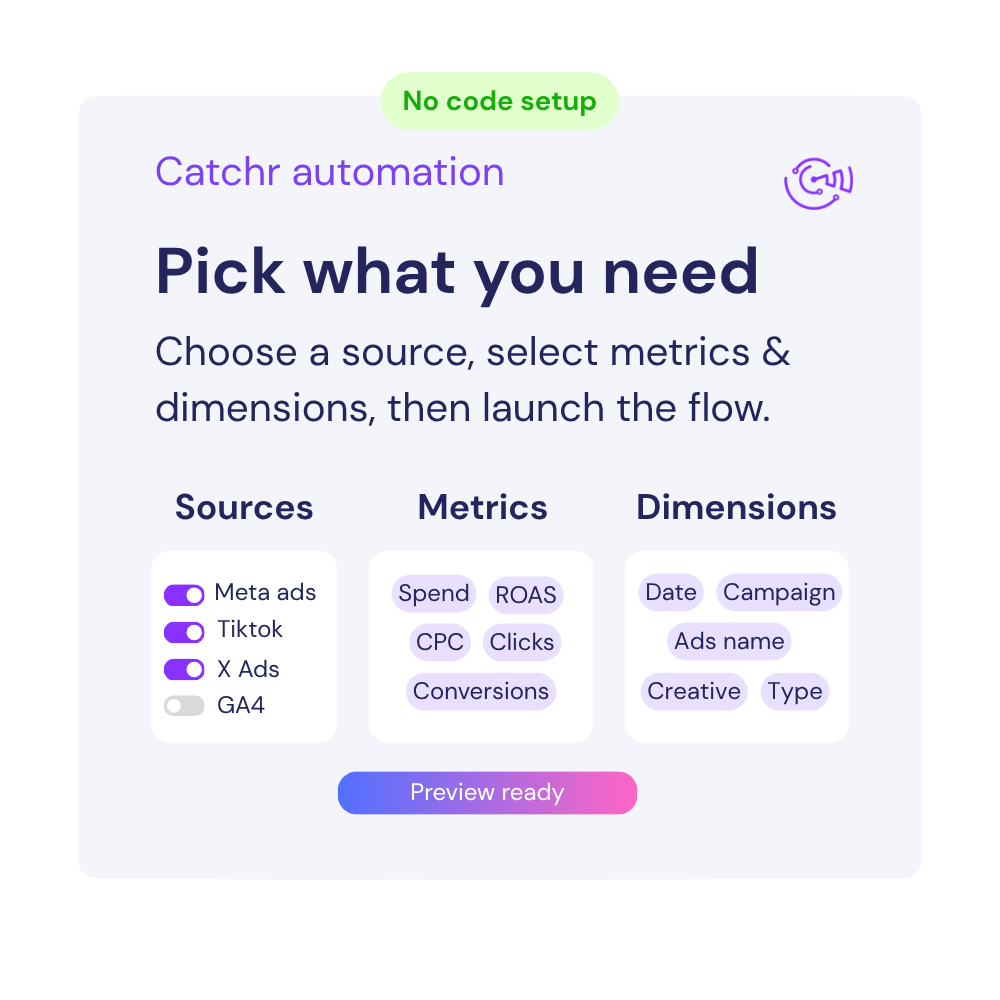
Available metrics
Available dimensions


What our customers say about us.
After three years of use, Catchr has become essential for both our teams and our clients. So far, it has been our best solution for compiling and analyzing data from different advertising platforms. It’s easy to set up, and the customer service is responsive and excellent.

With Catchr’s automated API, we can finally collect and centralize all advertising data, connect it with booking information, and calculate the real ROAS for our restaurant clients. It gives them full visibility, more autonomy, and the ability to optimize campaigns to maximize ROI.

The solution is a real game changer, providing optimal time savings for our data reporting. The major strength of the solution is their highly responsive and professional support.

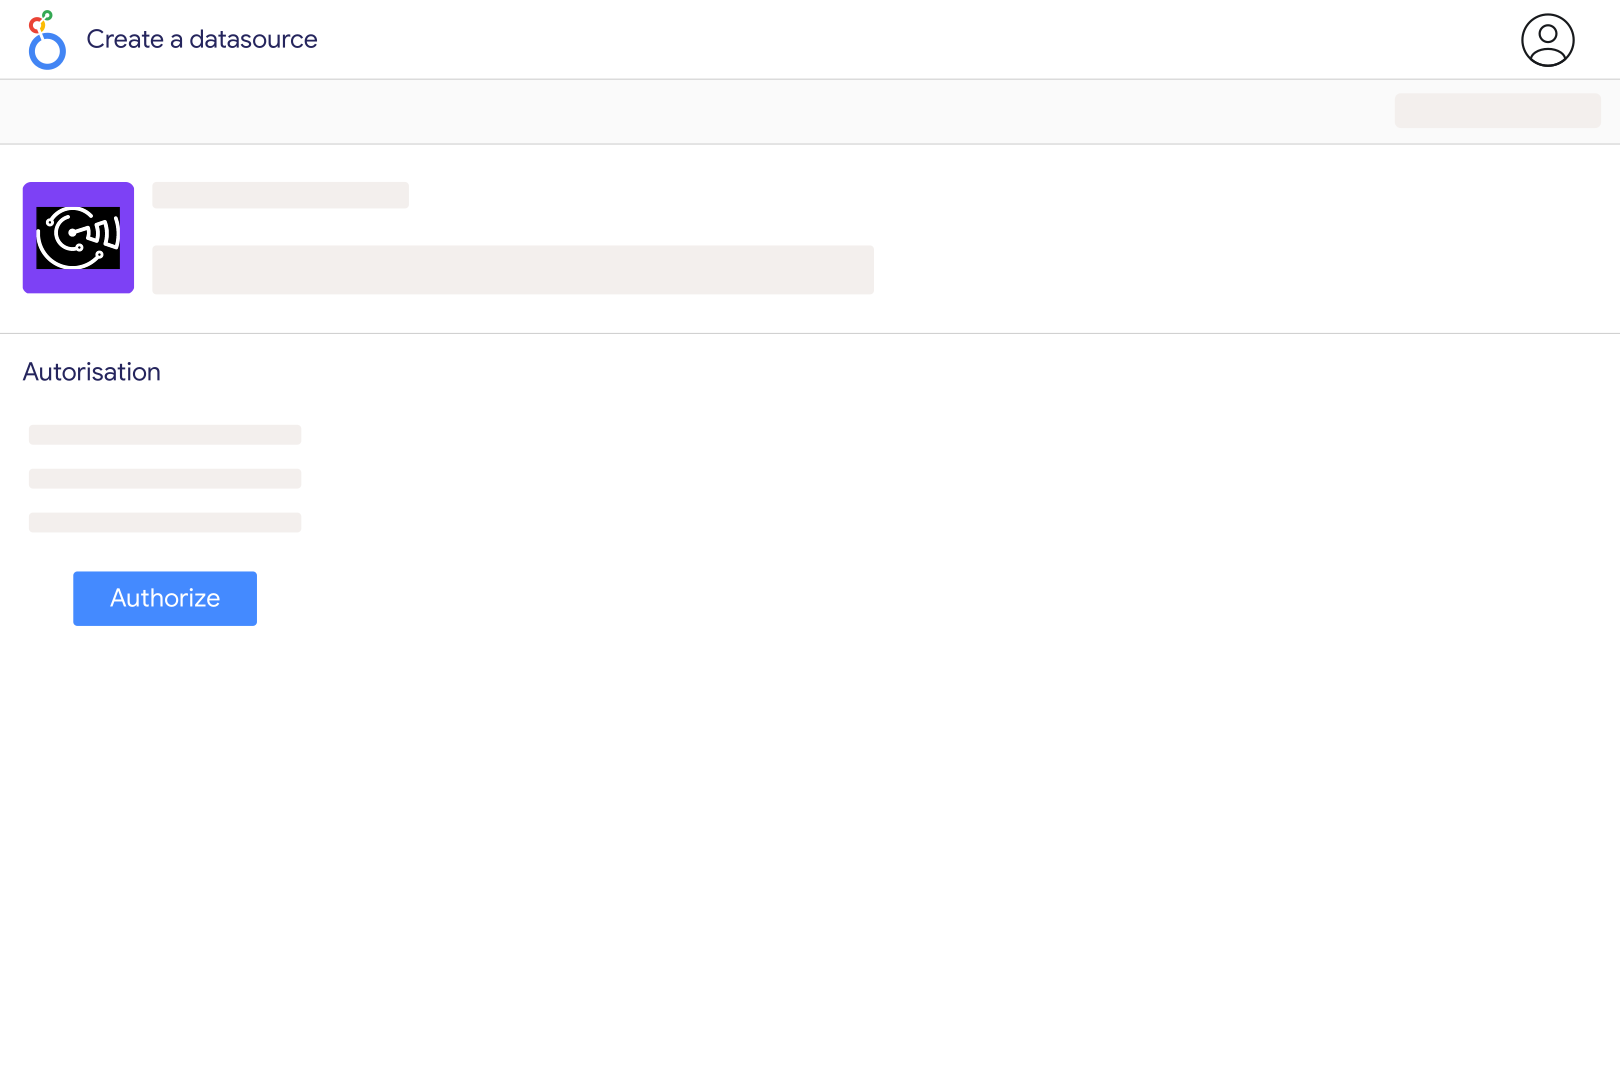
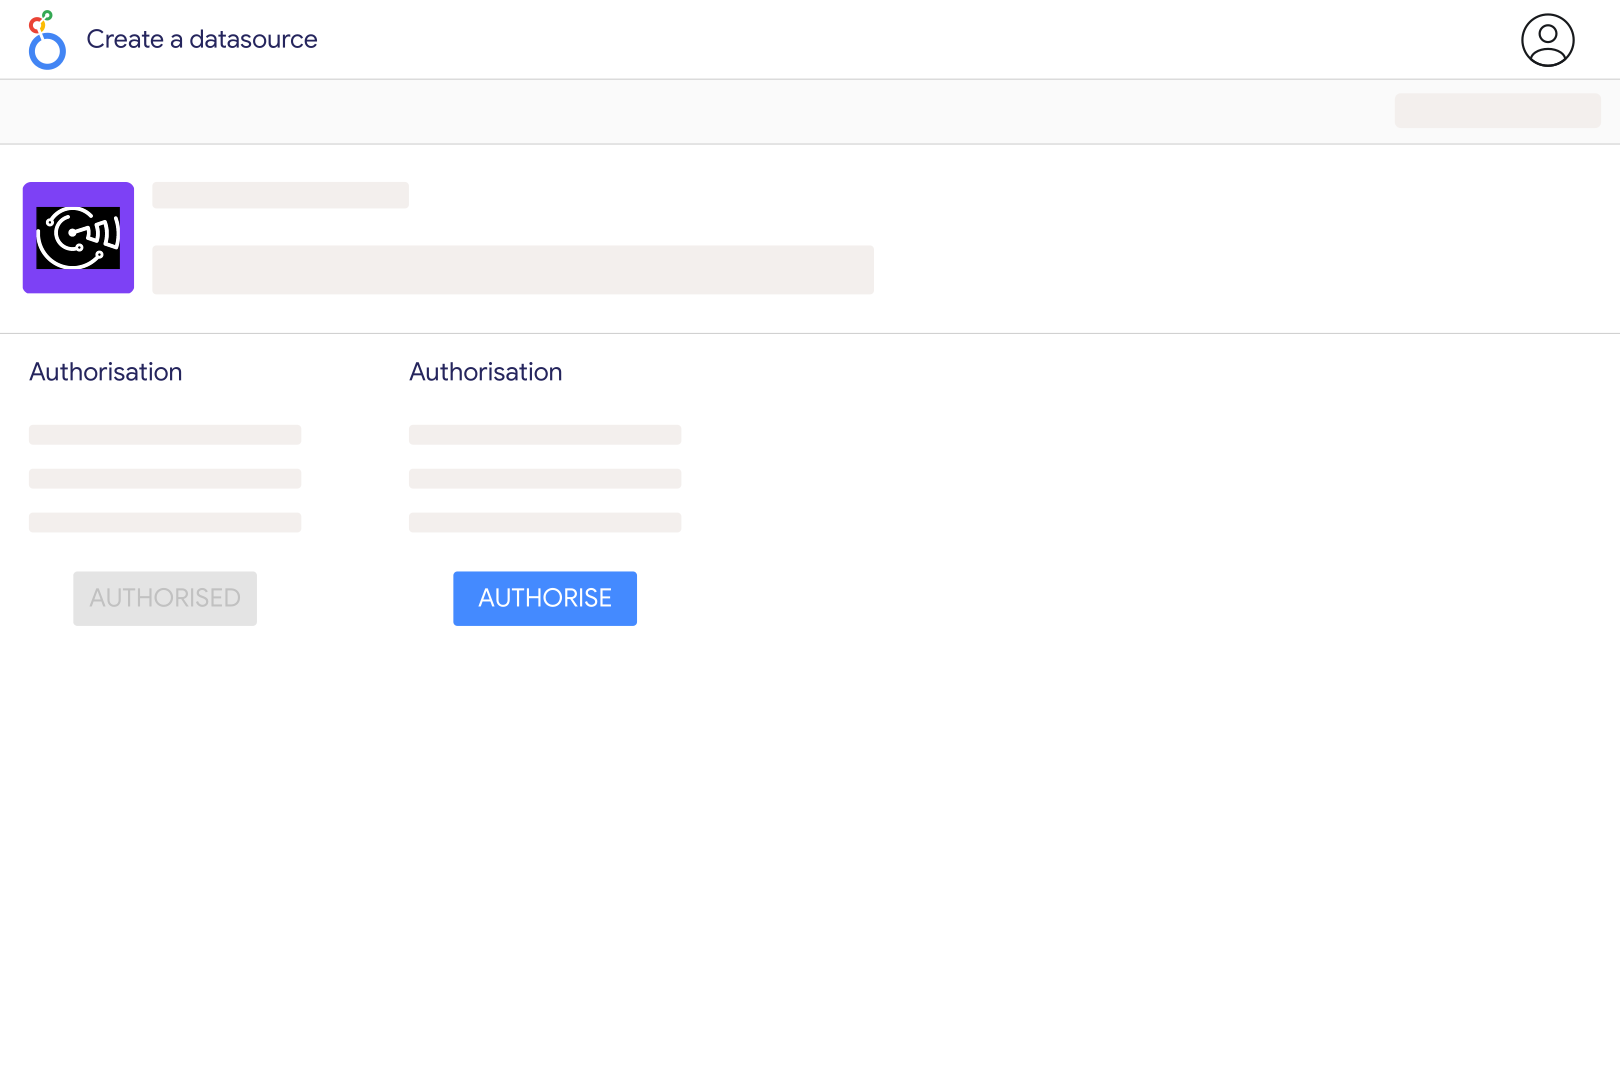
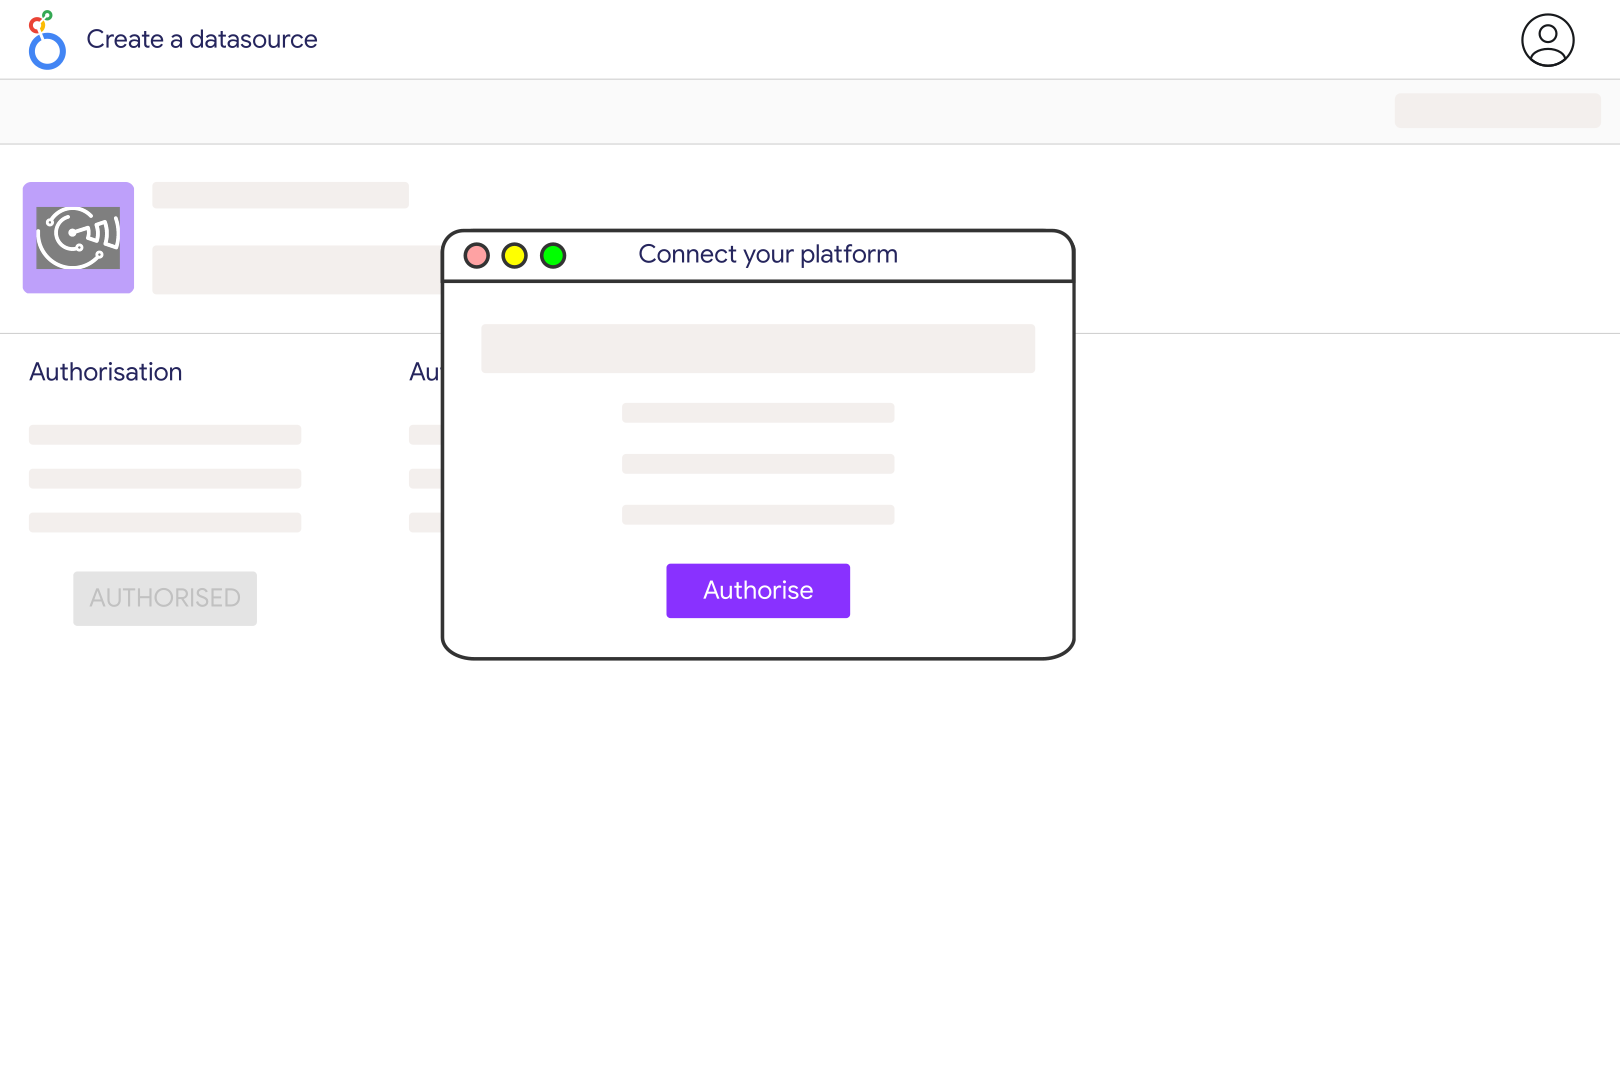
Create a Mixpanel connection in Catchr with a service account username, service account secret and Project ID. Select the US or EU data-residency region that matches the project, then open the Catchr connector in Looker Studio. Start with Event Name, Event Time and Records to confirm the selected project and dates before building more complex charts.
The current connector exports raw events. It does not import the results of saved Mixpanel funnels, retention reports or boards. You can chart event activity in Looker Studio, but a funnel needs logic for event order, user identity and conversion windows. Use Mixpanel for those existing analyses or prepare the required calculations before presenting an equivalent dashboard.
Catchr exposes Event Name, Event Time, Distinct Id, Insert Id, Device Id, browser, operating system, location and common referral or UTM properties where present. Other properties remain in Properties Json rather than automatically becoming individual columns. Records lets you count exported rows. The presence of an event property depends on what your tracking implementation sends.
The raw export does not apply the same event deduplication as Mixpanel reports. Compare the same event, project, period and filters, and inspect Event Name, Distinct Id, Event Time and Insert Id when checking duplicates. Counting exported rows can therefore differ from the total shown in a Mixpanel chart. Identity rules and report calculations can create further differences.
You can calculate a distinct count of exported identifiers, but that is not automatically the same as Mixpanel’s resolved user count. Anonymous and identified activity may use different IDs, and identity handling matters when comparing results. Label the metric accurately, apply the same scope and filters, and do not add daily unique counts to estimate monthly unique users.
This Catchr version flattens a fixed set of common properties and retains other values in Properties Json. Refreshing the field list does not automatically expose every custom key. If your report depends on a nested purchase value or product attribute, prepare that property as a usable field in a suitable transformation workflow before promising a chart based on it.
Yes. Add sources such as Google Ads to the same report and use consistent dates and campaign identifiers where available. Mixpanel UTM properties reflect the tracking you send, while ad platforms use their own attribution. Comparing activity and spend is useful, but joining them by date alone does not prove which ad caused an event.
Our team is always here to answer any questions you may have about our data connector.









