
Starter
For freelancers and small teams.
$ 24 /mo
Billed monthly · cancel anytime
Platforms3
Accounts10


Used by the world's leading companies








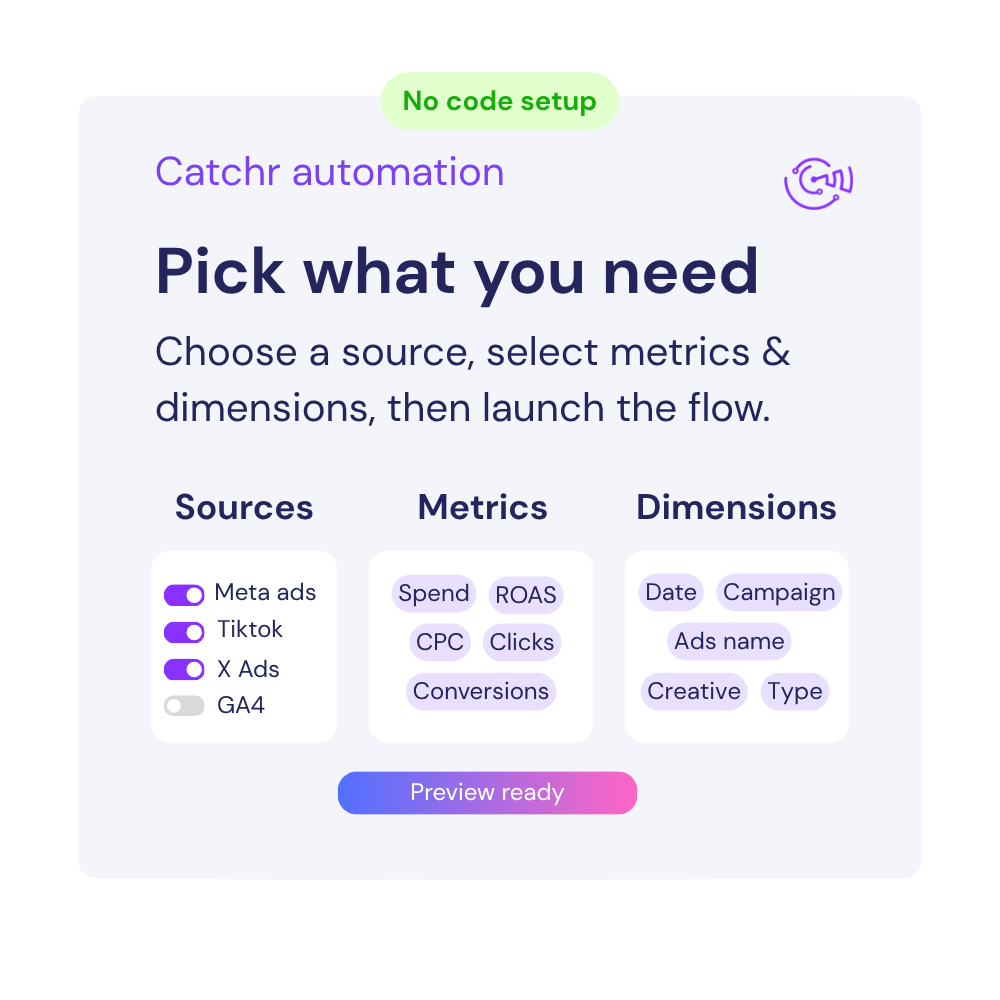
Available metrics
Available dimensions


What our customers say about us.
After three years of use, Catchr has become essential for both our teams and our clients. So far, it has been our best solution for compiling and analyzing data from different advertising platforms. It’s easy to set up, and the customer service is responsive and excellent.

With Catchr’s automated API, we can finally collect and centralize all advertising data, connect it with booking information, and calculate the real ROAS for our restaurant clients. It gives them full visibility, more autonomy, and the ability to optimize campaigns to maximize ROI.

The solution is a real game changer, providing optimal time savings for our data reporting. The major strength of the solution is their highly responsive and professional support.

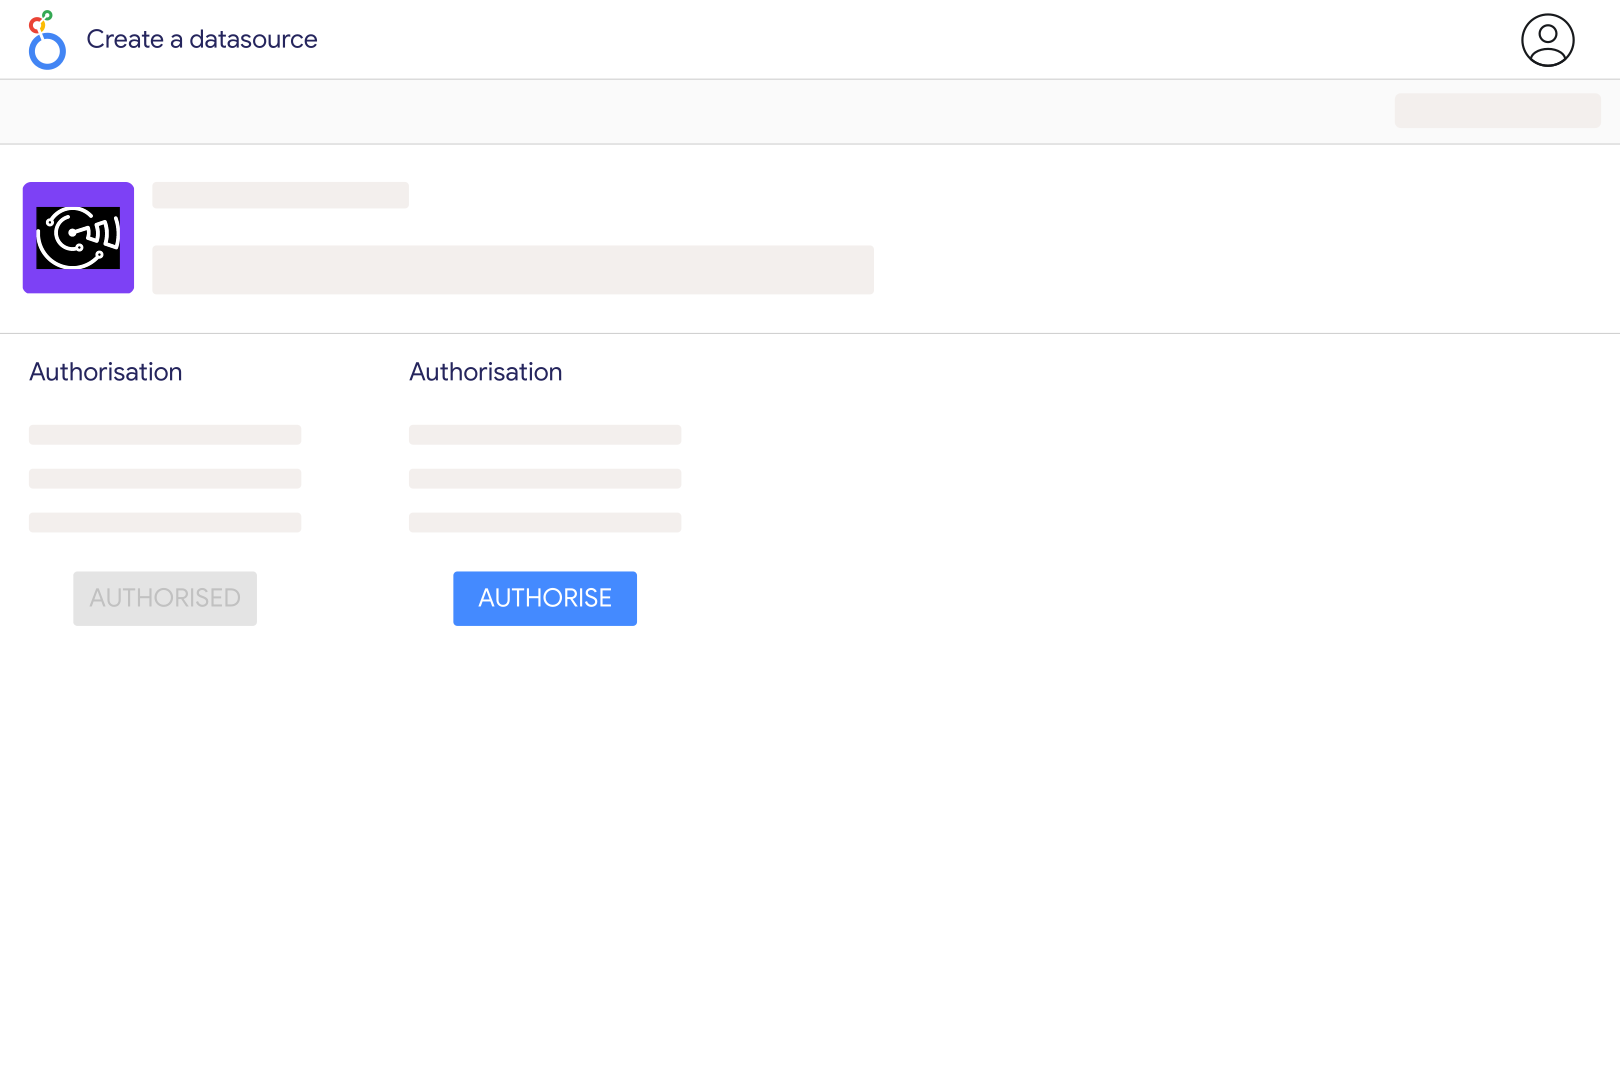
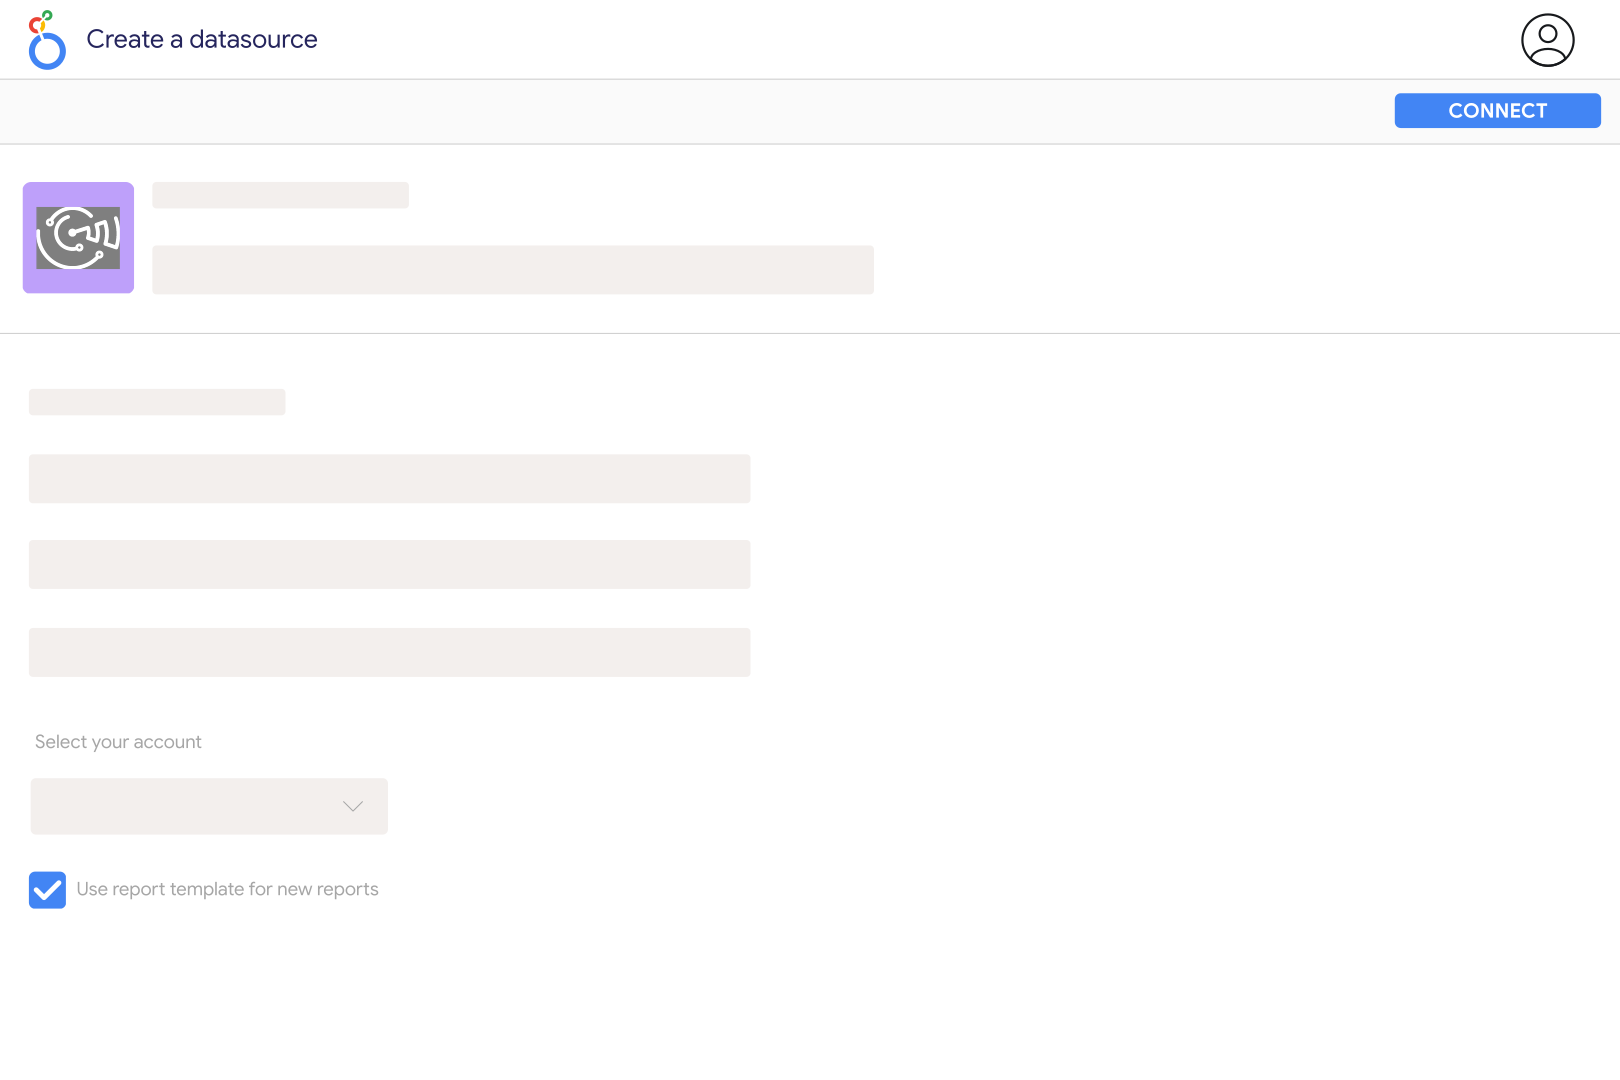
Connect Airtable in Catchr using access to the base you want to report on, then select the relevant table in the Catchr Looker Studio connector. Start with record ID and a few simple fields. Confirm that the table contains the reporting rows you expect before creating summary charts.
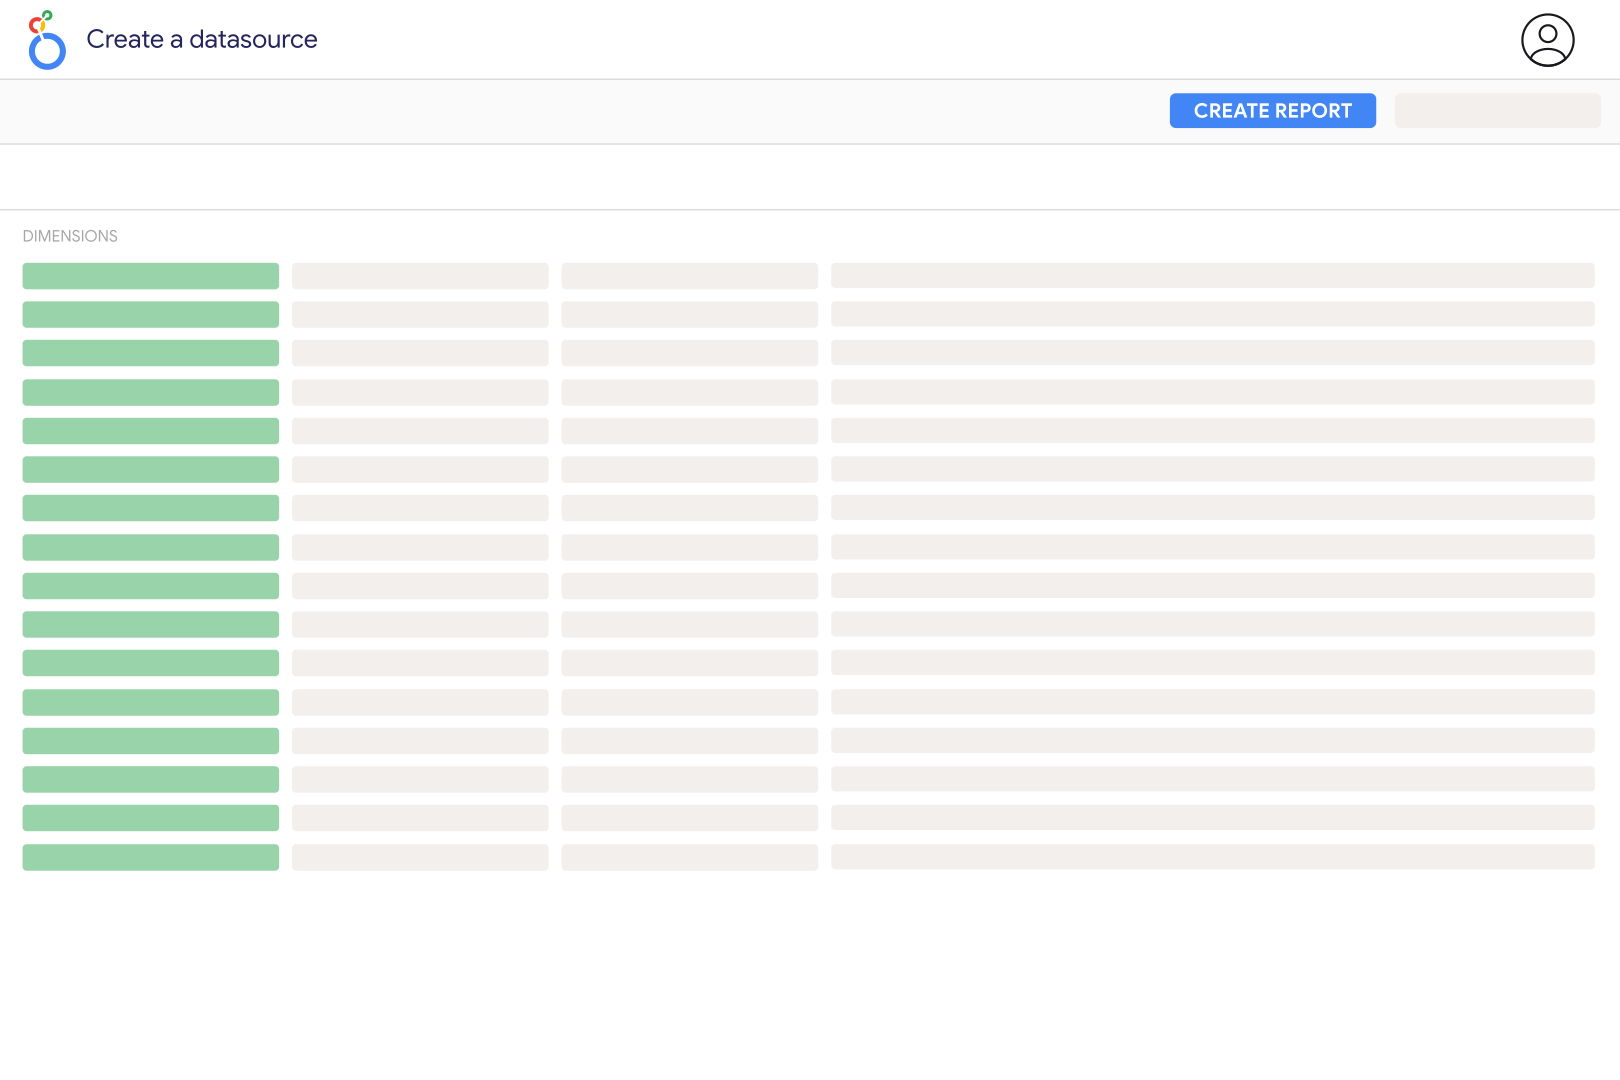
Yes. Catchr reads the selected table's field definitions and builds fields for the data source. The available columns therefore depend on your base rather than one universal marketing schema. Keep names and types consistent when several tables are intended to support the same dashboard.
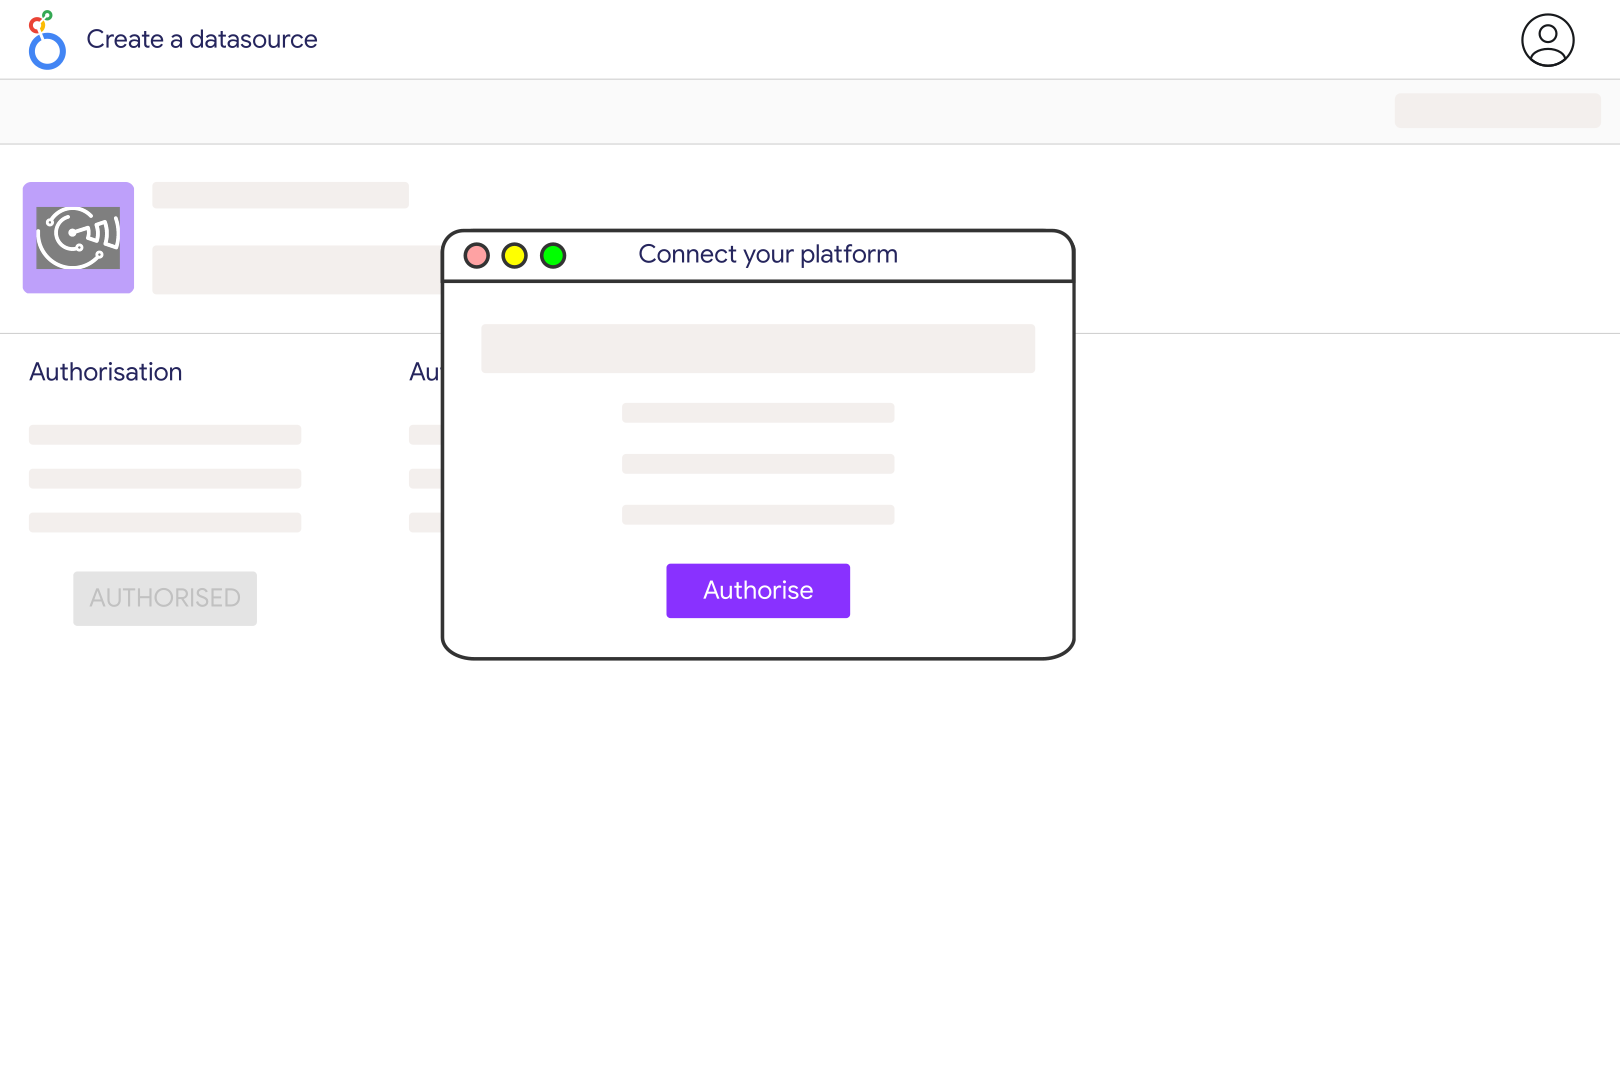
Check that the authorization includes the intended base and the necessary read access. Airtable personal access tokens have both scopes and resource permissions, and the token user's own permissions still apply. Access to one base does not automatically grant access to every base in the workspace.
Review and refresh the data source fields in Looker Studio after the schema changes. A new field needs to be recognized before charts can use it, and a changed type can affect existing calculations. Check dependent charts before sharing an updated report.
Yes, but linked records need deliberate handling. They represent relationships rather than a flat measure you can sum. Use record IDs to connect the relevant datasets and decide how multiple matches should be treated. A one-to-many relationship can repeat an amount and inflate totals if it is blended without aggregation.
Choose the business date that matches the question, such as campaign launch date, invoice date or task completion date. Record creation time only tells you when the row was created. Catchr exposes creation time separately; it should not silently replace the date on which the underlying activity occurred.
Yes. Add Google Ads and use consistent campaign identifiers to compare budget or planning rows with actual spend. Aggregate both sides to the same campaign and period before blending so a daily spend series does not repeatedly multiply a monthly budget.
Our team is always here to answer any questions you may have about our data connector.









