AI assistants have become a real discovery layer in the buying journey. People now ask AI tools for recommendations, comparisons, and shortlists before they click a traditional result. If your brand is missing there, you lose attention before the first website session.
If you want the foundational GEO framework, read What Is GEO?.
This article focuses on one practical question: how to measure AI brand visibility in a way that supports marketing decisions.

What "AI brand visibility means"?
AI brand visibility is your measurable presence inside AI-generated answers for prompts that matter to your audience and funnel. It is not just a mention count. Strong visibility means your brand appears in the right prompts, with the right positioning, supported by relevant citations, and linked to meaningful business outcomes.
Why it matters?
A brand can be mentioned often and still underperform. This usually happens when mentions appear on low-intent prompts, when AI describes the brand inaccurately, or when citations point to weak pages that do not move users toward action.
This is not marginal behavior anymore. Similarweb reports that AI assistants drove over 1.13B referral visits in June 2025, with +357% year-over-year growth, which confirms generative AI is now a meaningful brand discovery channel, not an edge case (Similarweb, 2025).
Measurement creates clarity. It helps teams separate surface-level visibility from commercial influence, identify where positioning breaks, and prioritize content updates with stronger impact on pipeline quality.
Freelance, agency, or in-house team, this matters because AI answers now shape brand perception early in the decision process.
- For freelancers, measuring AI brand visibility helps prove impact for client accounts and prioritize the content and positioning fixes that protect performance.
- For in-house teams, it ensures the company narrative is accurately represented in high-intent AI answers and connected to conversion-focused pages.
- For agencies, it becomes both a delivery KPI and a retention lever: showing clients that their brand is not only present, but correctly positioned where AI-driven shortlists are formed.
How to measure AI brand visibility?
Manual way: ask AI and note responses
Manual tracking is the best way to create a trusted baseline before you automate.
Step 1: Build a stable prompt set
Use real buyer language from sales calls, search queries, CRM notes, and client conversations. Include prompts across discovery, comparison, and decision intent so you do not measure only top-of-funnel visibility. Keep this set stable over time, otherwise month-to-month comparisons lose value.
Step 2: Run prompts and capture full answers
Test the same prompts in the AI environments that matter to your audience. Save full responses, not just whether your brand was mentioned, because wording and context are often where positioning issues appear. Add date, tool, and market/language context so results remain auditable.
Step 3: Log key signals in one tracker
For each prompt, record the essentials:
- brand presence
- answer position
- positioning accuracy
- citation quality.
Citation quality should reflect both source credibility and intent fit (for example, whether AI cites a decision-stage page when the prompt is decision-stage). This turns qualitative outputs into data your team can actually use.
Step 4: Score and prioritize gaps
Apply a simple scoring model so all prompts are judged consistently. Then identify high-impact gaps: missing visibility on high-intent prompts, incorrect brand narrative, or citations pointing to weak pages. Prioritize fixes by business value, not by volume alone.
Step 5: Update pages and remeasure monthly
Implement targeted updates on the pages linked to your biggest gaps, then rerun the exact same prompt set next cycle. Track score movement and link it to performance signals like qualified sessions, demo intent, and lead quality. This is what turns manual checking into a repeatable optimization loop.
Automated way: track prompts, score trends, and connect to outcomes
Automation is where AI visibility becomes an operating system, not a manual exercise. With Catchr’s Brand Hub GEO feature, teams can move from ad hoc checks to a repeatable process: structured prompt libraries, recurring measurement, trend analysis, and business-level reporting.
A practical workflow looks like this:
1. Structure monitors from your validated prompt library
Start with the prompt sets you already tested manually, then organize them into monitors by funnel stage, persona, or use case. This gives you analysis-ready segments instead of one blended visibility score that is hard to act on.
2. Track visibility continuously at monitor level
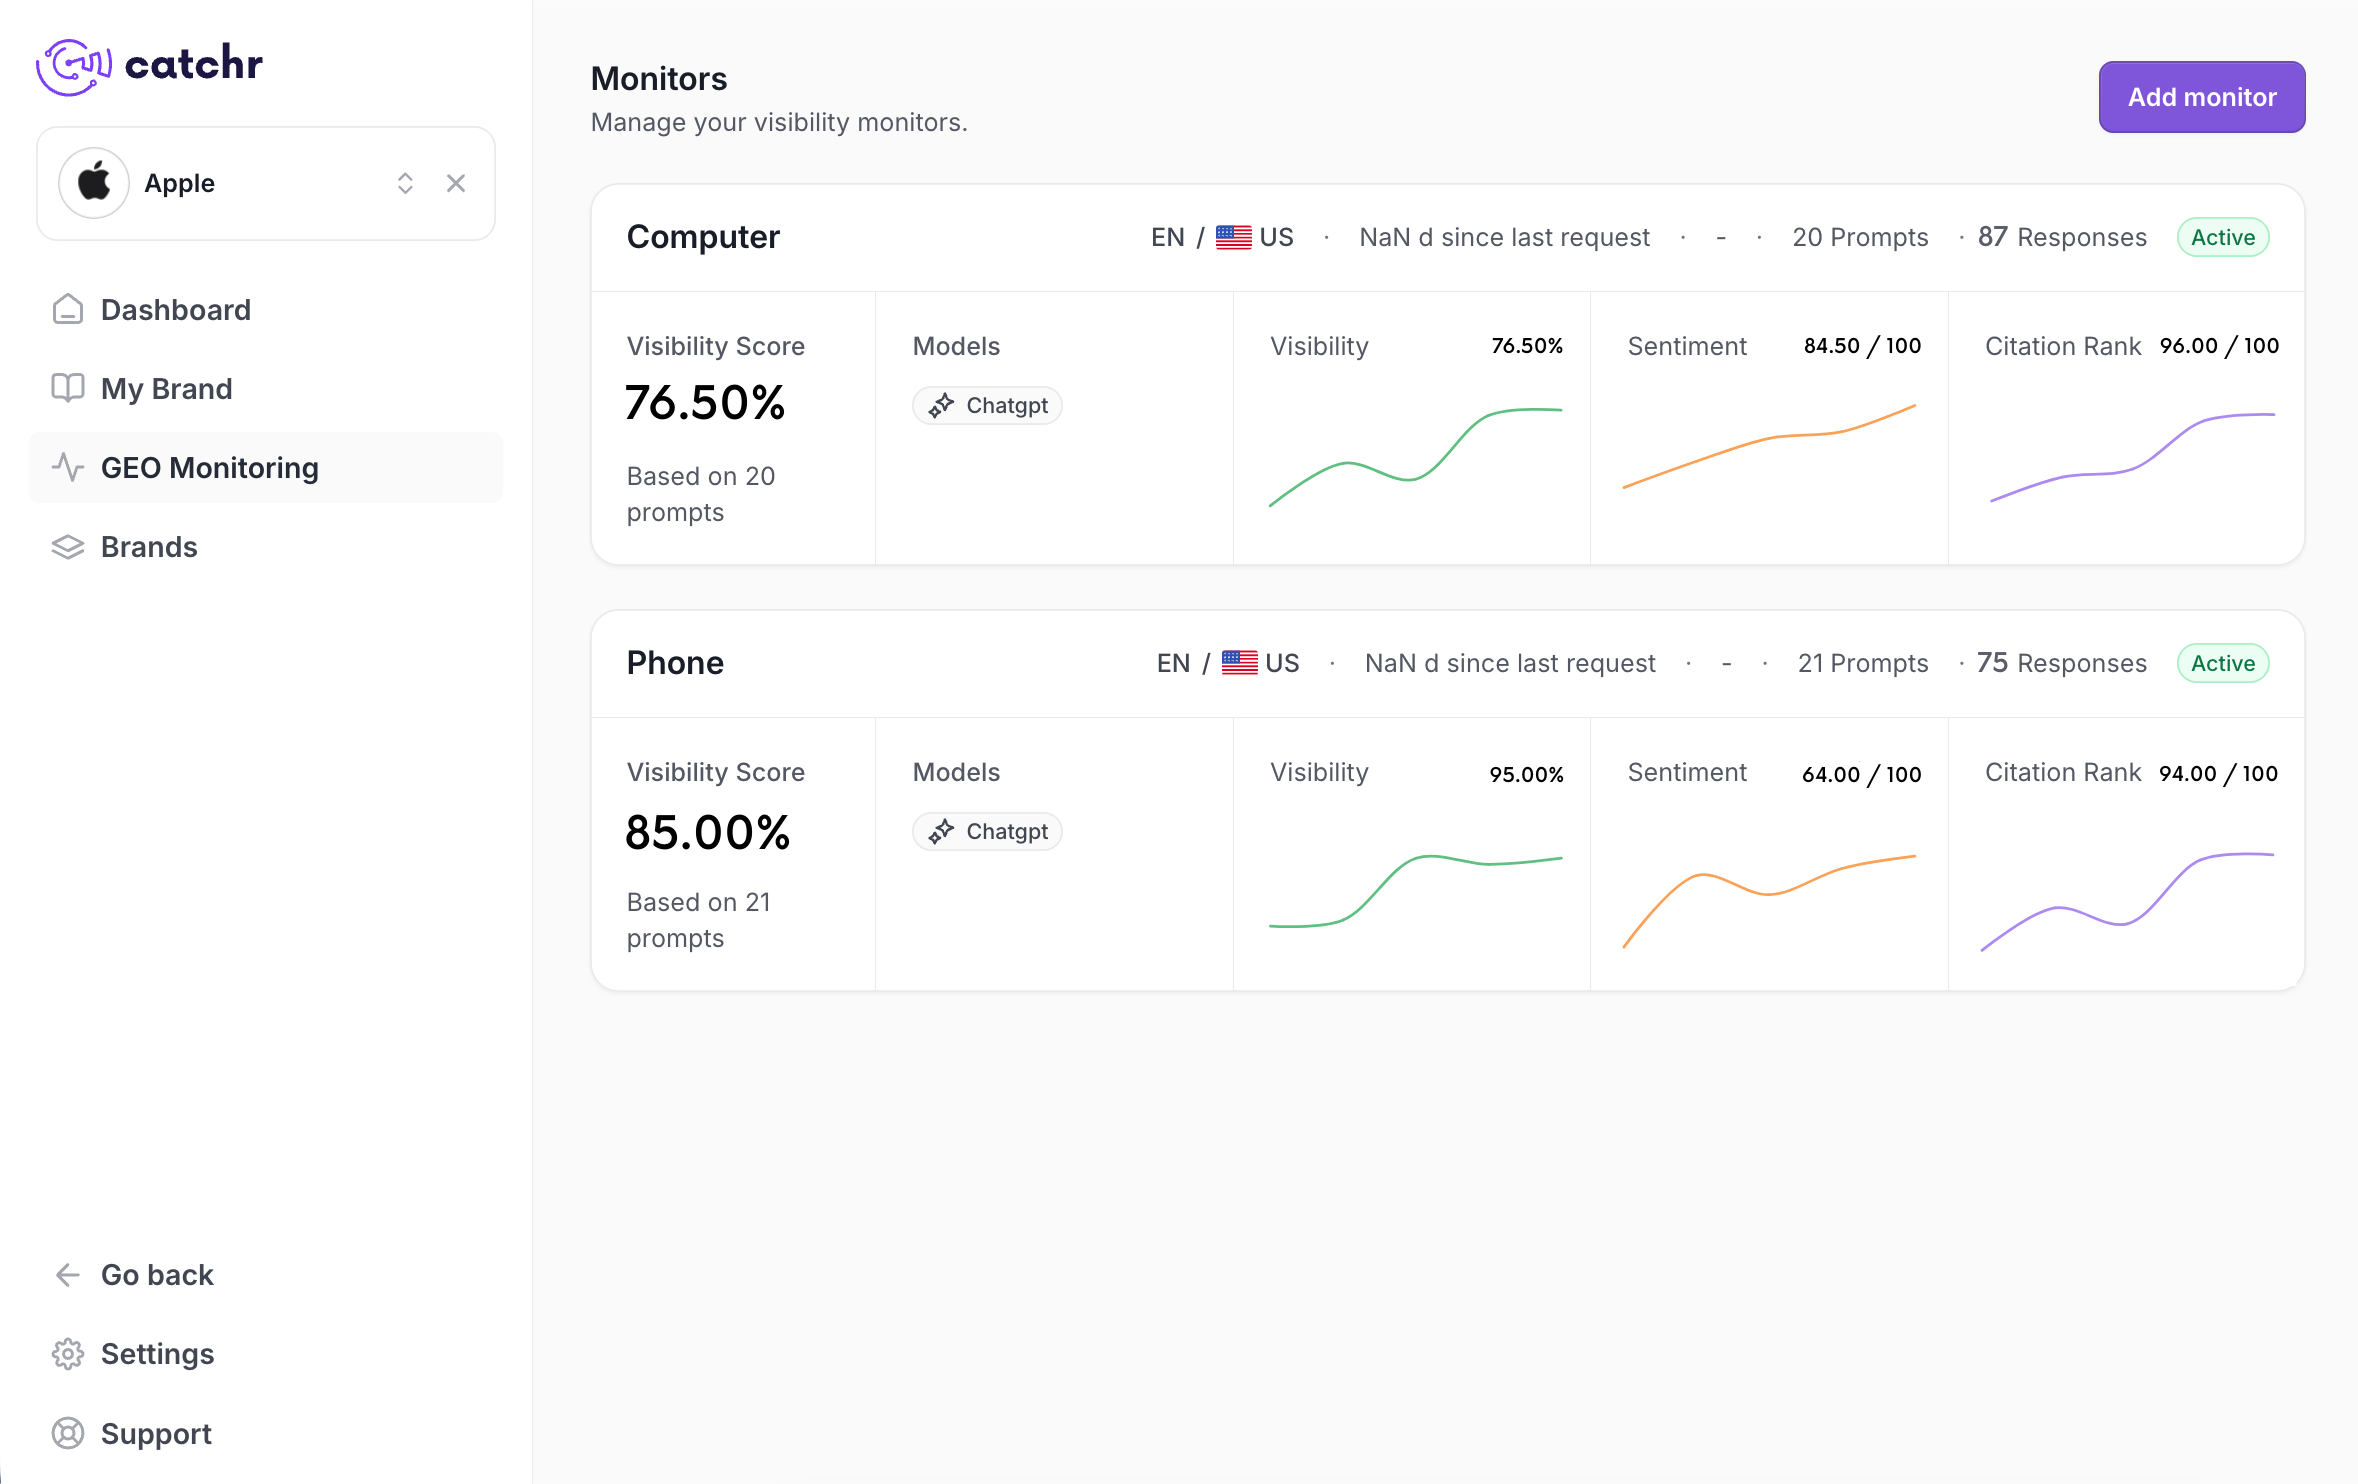
With Brand Hub GEO, each monitor is tracked as an ongoing visibility dataset, not a one-off snapshot. Catchr analyzes key signals in GenAI responses and aggregates them into a global visibility score per monitor.
For each monitor, Catchr tracks:
- Sentiment: how positively, neutrally, or negatively the brand is presented
- Citations: whether sources are present and which pages are referenced
- Position: where the brand appears in the answer (top, middle, lower)
- Global visibility score: a consolidated score to evaluate overall monitor performance
3. Detect shifts faster and prioritize with confidence
Because measurement is consistent across cycles, teams can identify meaningful movement quickly: which audience segment dropped, which use case improved, and where positioning changed. That stability reduces scoring drift and makes prioritization more reliable.
4. Connect visibility to performance outcomes
The main advantage of automation is impact attribution. With Brand Hub GEO plus your reporting stack, teams can move from “Did we appear?” to “Did better visibility improve qualified traffic, demo intent, lead quality, and assisted revenue?” This is what turns AI visibility into a real growth KPI.
Final takeaway
AI visibility should be managed like a performance channel, not a side metric.
When freelancers, in-house teams, and agencies measure presence with consistency and tie it to outcomes, they turn AI discovery into a controllable growth lever.
.png)