.png)
Facebook Ads Manager gives you data. What it does not give you is a clear, shareable report. The native interface is built for campaign management, not for communicating results: columns are fixed, historical comparisons are limited, and sending a screenshot to a client or stakeholder never looks good.
A dedicated reporting dashboard solves this. It pulls your Facebook Ads data into a live, structured view you can share, automate, and customize around the metrics that actually matter to your business.
This article shows real Facebook Ads reporting dashboard examples across three platforms: Data Studio (ex-Looker Studio), Google Sheets, and Power BI. For each one, we explain what the dashboard contains, what it looks like, and how to get your own copy. We also cover what makes a good Facebook Ads report and how to connect your data to any destination using Catchr.
What a Good Facebook Ads Reporting Dashboard Should Include
Before looking at examples, here is what separates a useful Facebook Ads dashboard from a data dump.
The right metrics
A complete Facebook Ads report covers three layers of performance:
- Visibility: Impressions, Reach, Frequency, CPM: how many people saw your ads, and at what cost.
- Engagement: Clicks, CTR, CPC, Link Clicks, Outbound CTR: how people interacted with them.
- Conversion: Purchases, ROAS, CPA, Leads, CPL, Add to Cart: the results those interactions produced.
Campaign and ad set breakdowns.
Account-level metrics tell you what happened overall. Campaign and ad set breakdowns tell you why. A good dashboard lets you drill down from the account view to individual campaigns, then to ad sets, to understand which parts of your strategy are working and which are not.
Creative performance and ad fatigue tracking.
Campaign and ad set data tell you where your budget is going. Creative data tells you why performance is going up or down. A good Facebook Ads dashboard includes a dedicated creative view that breaks performance down by ad name, format, and placement, so you can identify which visuals and copy are driving results and which are starting to fatigue.
Ad fatigue shows up in the numbers before it shows up in intuition: frequency climbs, CTR drops, CPA rises, but the campaign-level view looks fine because a few strong ads are masking the weak ones. A creative breakdown catches this early. Key signals to track per ad: Frequency, CTR, CPC, ROAS, Purchases, and Reach. When frequency is high, and CTR is declining for a specific ad, that creative needs to be refreshed or paused.
Filters and date controls.
A fixed screenshot is not a report. A useful dashboard lets you filter by date range, campaign objective, platform (Facebook vs. Instagram), ad name, and placement, and applies those filters across every page simultaneously.
Automatic refresh.
Manually exporting data and updating a spreadsheet is a process that breaks every time someone forgets to do it. The best dashboards refresh automatically on a schedule, so the data is always up to date without any manual intervention.
Facebook Ads Reporting Dashboard Examples
Below are seven real dashboard examples across Data Studio, Google Sheets, and Power BI. The first three are built with Catchr's free templates and connector. The following four come from other tools on the market.
Example 1: Meta Ads Dashboard in Data Studio (ex-Looker Studio)
A four-page interactive report covering the full Meta Ads account. Each page focuses on a different level of analysis: top-level performance, audience demographics, campaign breakdown, and conversion funnel. A shared filter panel on the left applies date range, campaign, platform, and ad filters across all pages simultaneously.

What this dashboard contains:
- Overview page: Spend, Revenue, Impressions, Clicks, CTR, ROAS, Purchases, and CPA in scorecards with period-over-period comparison. Spend and Revenue trend chart by day. Spend breakdown by campaign name (pie chart).
- Audience page: Performance segmented by age, gender, and country. Helps identify which demographics drive the best results.
- Campaign page: Per-campaign performance table with Spend, Revenue, Impressions, CPM, Clicks, CPC, Conversions, CPA, and ROAS. Color-coded bars for quick visual comparison.
- Ad page: Ad performance table with a breakdown by creative and placement, including Reach, Frequency, CTR, CPC, ROAS, and Purchases.
- Funnel page: Impression-to-purchase conversion path, showing where drop-offs occur across the account.
- Filters: Date range, campaign name, platform (Facebook vs. Instagram), ad name, applied across all pages.
Platform: Data Studio (ex-Looker Studio), free, browser-based, shareable via link
Get the template: Meta Ads Data Studio Template
Example 2: Meta Ads Dashboard in Google Sheets
A spreadsheet-based dashboard for teams who prefer to work in Google Sheets or need to combine Facebook Ads data with other spreadsheet data (budgets, targets, manual inputs). The template is built as a structured dashboard with charts and summary tables, not a raw data export. It installs via the Catchr Google Sheets add-on and refreshes on a schedule without any manual exports.

What this dashboard contains:
- Summary tab: Key KPIs at account level: Spend, Impressions, Reach, Clicks, CTR, CPC, Conversions, CPA, ROAS with period comparison.
- Campaign tab: Per-campaign breakdown table with the same KPI set, sortable by any column.
- Charts: Spend and performance trend lines, spend by campaign breakdown.
- Refresh: Automatic via the Catchr add-on. Set a schedule and the data updates without opening the file.
- Customization: Full access to all cells and formulas. Add your own calculated fields, targets, or budget tracking columns.
Platform: Google Sheets, free, collaborative, works alongside existing spreadsheets
Get the template: Meta Ads Google Sheets Template
Example 3: Meta Ads Dashboard in Power BI
A Power BI report for teams already using Microsoft's BI ecosystem. The template connects to Facebook Ads data via Catchr's API endpoint and includes three pre-built datasets: account-level KPIs, campaign performance, and platform breakdown (Facebook vs. Instagram), linked by date and account name inside Power BI. All of Power BI's native interactivity (cross-filtering, drill-through, custom visuals) works out of the box once the data is connected.

What this dashboard contains:
- Account overview: Spend, Impressions, Reach, Clicks, CTR, CPC, CPM, ROAS, Purchases, and CPA at the account level with trend charts.
- Campaign breakdown: Per-campaign performance table with full KPI set and visual bars.
- Platform comparison: Facebook vs. Instagram side-by-side performance: spend, clicks, ROAS, and conversions per platform.
- 3 datasets: Pre-configured queries for account, campaign, and platform data, linked by date and account name in Power Query.
- Refresh: Scheduled refresh via Power BI Service once published, or manual refresh on desktop.
Platform: Power BI, Microsoft ecosystem, advanced data modeling, embeddable in Teams and SharePoint
Get the template: Meta Ads Power BI Template.
Example 4: Facebook Ads Dashboard in Google Sheets
A connected Google Sheets dashboard built by Coefficient that links directly to live Facebook Ads data. The template includes a visual summary of clicks and reach with sparkline trend charts, a per-campaign spend breakdown, and KPI scorecards for CPC, CPM, CTR, and ad spend. Unlike a static export, the data refreshes automatically, and the entire sheet can be shared and edited in real time with your team.
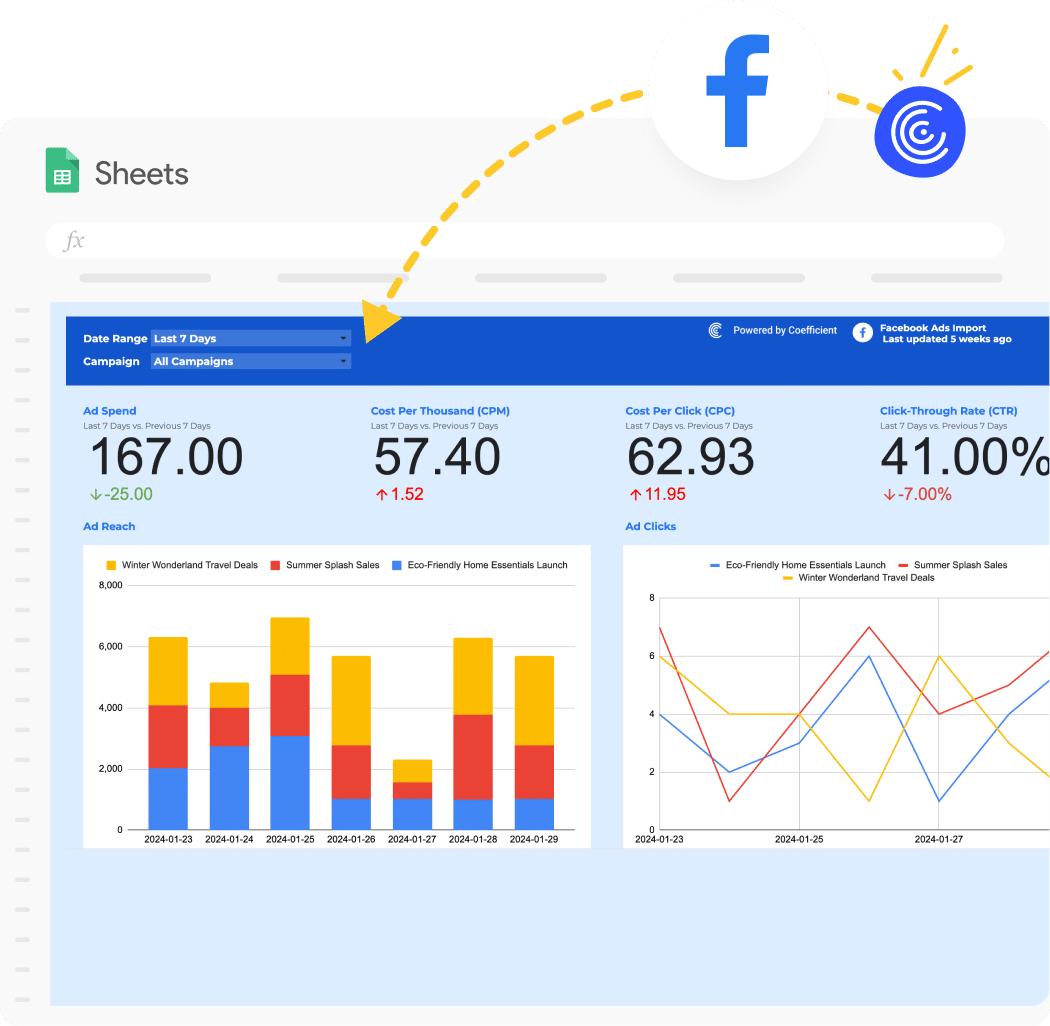
What this dashboard contains:
- Metrics: Clicks, Reach, Impressions, CTR, CPC, CPM, Ad Spend per campaign, with trend sparklines per metric.
- Breakdowns: By campaign (spend, clicks, reach, CTR, CPC); trend lines by date for clicks and reach.
- Pages: Single dashboard tab with KPI scorecards, trend charts, and campaign breakdown table.
- Ideal for: Teams who want a live, collaborative Google Sheets dashboard for Facebook Ads without building it from scratch.
Platform: Google Sheets
See the template: Coefficient Facebook Ads Google Sheets Dashboard.
Example 5: Looker Studio Facebook Ads Report Template
A native Whatagraph dashboard that connects directly to your Facebook Ads account without a third-party connector. The template includes an interactive performance overview with real-time data, pre-built widgets for all core KPIs, and a white-label layout ready to share with clients via a live link or password-protected URL. Cross-channel data can be added alongside Facebook Ads (Google Ads, TikTok, LinkedIn) without leaving the platform. An AI chatbot is built in to provide on-demand performance summaries and natural-language insights.

What this dashboard contains:
- Metrics: Spend, Reach, Impressions, CTR, CPC, CPM, Conversions, ROAS, Conversion Rate, Frequency with period-over-period comparison widgets.
- Breakdowns: By campaign, by ad set, by audience (age, gender, location, device); cross-channel view available combining Facebook Ads with other ad sources in the same dashboard.
- Features: AI-generated performance summaries, custom KPIs, white-label branding (logo, custom domain), live shareable link with optional password, and automated scheduled delivery.
- Ideal for: Agencies managing multiple client accounts who want a native, all-in-one reporting platform without connecting external BI tools.
Platform: Whatagraph (native, no external BI tool required)
See the template: Whatagraph Facebook Ads Dashboard
Example 6: Facebook Ads AI-Generated Dashboard
Catchr's MCP (Model Context Protocol) connector lets you query your Facebook Ads data directly from an AI assistant like Claude. Instead of opening a BI tool, you can ask for a custom report in plain language, and the AI builds it on the spot using live data pulled through Catchr. The example below was generated with a single prompt: "Using Catchr MCP, analyze my Facebook Ads account and build an HTML performance dashboard for Catchr ad account." The AI agent queried the connected Facebook Ads account via Catchr, pulled spend, clicks, sign-ups, and campaign-level data for the last 30 days, and generated a self-contained HTML dashboard with scorecards, charts, and tables, styled and structured without any manual template setup.
What this dashboard contains:
The example above shows what a generic prompt produces: the AI agent picked what it judged most relevant from the account data and built scorecards, charts, and tables around it. In this case, that meant:
- Scorecards: Amount Spent, Link Clicks and CTR, Sign-ups (conversions), Cost per Sign-up, each with period-over-period change.
- Charts: Weekly spend vs. sign-ups bar chart with callouts (best week, CPA trend, weekend spend pattern); acquisition funnel from Impressions to Link Clicks to Landing Page Views to Sign-ups, with stage-to-stage conversion rates.
- Campaign breakdown table: Spend, Impressions, CTR, CPC, Sign-ups, and CPA per campaign, with status tags (Active, Learning, Paused).
- Creative breakdown table: Top-performing ads by format (carousel, video, image) with CTR, CPC, and Sign-ups per creative, surfacing which messaging and formats drive the most conversions.
This is just a starting point. The output depends entirely on the prompt. A generic request produces a generic overview, but specifying the objective and the exact KPIs steers the dashboard precisely: "focus on ROAS and CPA for the Sales campaigns, break down by ad set, and flag anything with frequency above 4" will produce a very different report, built around those specific metrics and breakdowns rather than a general account summary.
- Ideal for: Enterprise teams who want AI-generated dashboards built from natural language requests, without manual template setup.
- Quick dashboards for account audits: get an instant, structured overview of a new or unfamiliar account without having to build anything first.
- Analysis and troubleshooting with AI assistance: ask the AI to dig into why a metric moved, which campaigns or ads are underperforming, or where the funnel is leaking.
- Suggested fixes: beyond reporting, the AI can recommend concrete optimizations based on the data it just analyzed, such as which ads to pause, which audiences to scale, or where to adjust budget.
Platform: Claude or ChatGPT with Catchr’s MCP
See the video:
How to Get Your Facebook Ads Data into Any Dashboard
The dashboard examples above all start from the same place: a reliable connection between your Facebook Ads account and your reporting tool. That connection is where most teams lose time: manual CSV exports, broken API keys, and data that stops refreshing on weekends.
Catchr's Facebook Ads connector solves this. It connects your Meta Ads account to any destination in a few clicks, with no code required, and keeps the data refreshed automatically.
Send your data to any destination.
Catchr connects Facebook Ads to every major reporting and storage destination:
Full list of destinations: catchr.io/destinations
Which Reporting Platform Should You Use for Facebook Ads?
The right platform depends on how you work and who you are reporting to.
- Data Studio: Best for live, shareable dashboards sent to clients or stakeholders via a link. Free, browser-based, no software to install. The right choice for most agencies and media buyers.
- Google Sheets: Best if you need to combine Facebook Ads data with other spreadsheet data (budgets, targets, manual inputs) or if your team already works in Sheets. More flexible for custom calculations.
- Power BI: Best for teams in the Microsoft ecosystem (Teams, SharePoint, Azure) or for complex data models combining multiple sources. Steeper learning curve, but more powerful for advanced analytics.
- BigQuery / database: Best for storing long-term historical data (beyond Facebook's 37-month API limit) or for joining Facebook Ads data with CRM, e-commerce, or other business data via SQL.
- API / JSON: Best for developers building custom dashboards, internal tools, or automated data pipelines that need raw Facebook Ads data on demand.
How to Set Up a Facebook Ads Dashboard with Catchr
Getting from zero to a live, auto-refreshing dashboard takes under 5 minutes:
- Create a Catchr account at catchr.io and start your 14-day free trial. No credit card required.
- Connect your Facebook Ads account: go to Sources, search for Facebook Ads, authenticate with your Meta account, and select your ad account.
- Choose your destination: Data Studio, Google Sheets, Power BI, or any other destination from the list.
- Pick a template: copy one of the free Catchr templates for your chosen platform and swap the data source to your Catchr source.
- Set a refresh schedule: configure how often the data should update: hourly, daily, or on a custom schedule.
- Your dashboard is live and updates automatically going forward.
Questions About Facebook Ads Reporting Dashboards
What is a Facebook Ads reporting dashboard?
A Facebook Ads reporting dashboard is a visual report that pulls data from your Meta Ads account and presents it in a structured, shareable format. Unlike Facebook Ads Manager, which is designed for campaign management, a reporting dashboard is designed for communication: with clients, stakeholders, or your own team. It typically shows KPIs at the account level, campaign breakdowns, trend charts, and audience insights in a customizable layout you can share.
What metrics should a Facebook Ads dashboard show?
A complete Facebook Ads dashboard should cover three layers: visibility metrics (Impressions, Reach, Frequency, CPM), engagement metrics (Clicks, CTR, CPC, Link Clicks), and conversion metrics (Purchases, ROAS, CPA, Leads, Add to Cart). The conversion layer is the most important for budget decisions and is often missing from basic dashboards.
What is the difference between Facebook Ads Manager and a reporting dashboard?
Facebook Ads Manager is a campaign management interface. It shows live data for your active campaigns but has limited historical range, fixed column sets, and no easy way to share results outside of Meta. A reporting dashboard is built specifically for analysis and sharing: you choose the metrics, layout, and time range, and you can share it via a link, export it as a PDF, or embed it in a client portal.
How do I connect Facebook Ads to Data Studio, Sheets, or Power BI?
You need a connector that reads data from the Facebook Ads API and makes it available in your reporting tool. Catchr is a no-code connector that handles this for Data Studio, Google Sheets, Power BI, and 10+ other destinations. Setup takes under 5 minutes: connect your Facebook Ads account in Catchr, choose your destination, and copy the relevant template.
How many fields are available in the Catchr Facebook Ads connector?
Catchr gives access to 650+ fields from the Facebook Ads API and more. This includes all standard metrics, objective-specific fields, creative dimensions, audience breakdowns, and attribution settings. The full list is available at catchr.io/metrics/facebook-ads-metrics.
Can I use one connector for multiple Facebook Ads accounts?
Yes. Catchr supports multi-account setups. You can connect multiple ad accounts to the same data source and filter by account in your dashboard, or create separate data sources per client if you prefer to keep reports isolated.
Bottom Line
A good Facebook Ads reporting dashboard is not just a collection of metrics. It is a structured view that makes performance clear at a glance: what was spent, what it returned, which campaigns drove results, and where the opportunities are.
The seven examples in this article cover the most common reporting setups for media buyers and agencies, across Data Studio, Google Sheets, Power BI, and dedicated reporting tools. The Catchr templates are free to copy and connect in under five minutes, with 664 fields available and custom attribution settings built in.
Browse Facebook Ads templates for Data Studio: catchr.io/templates/looker-studio/facebook-ads
Connect Facebook Ads to your reporting tool: catchr.io/connectors/facebook-ads
Start your 14-day free trial: app.catchr.io