Blog post
Catchr
Power BI
TikTok Organic

Welcome to this comprehensive tutorial designed to guide you through the process of connecting your TikTok marketing data to PowerBI by leveraging Catchr. By the end of this tutorial, you will have the know-how to visualize your TikTok analytics within PowerBI, creating powerful dashboards and reports to inform your marketing strategies.
Navigating the Catchr interface is simple. Start on the homepage and look for the "Source" option on the left-hand menu. There, you will find the button "Add a Source" on the top right corner. Click on this to initiate the connection process. Select TikTok as your platform of choice and authenticate to bridge your TikTok account with Catchr.

Follow these clear steps to facilitate the seamless transfer of TikTok data into your PowerBI environment:


With PowerBI Desktop, you can source data from a plethora of origins. In our case, we use a web data source to import the TikTok data:


It may take a moment for PowerBI to process and import your data. Once done, you're free to modify your query and start sculpting your dashboard to share splendid insights with your team or clients.
To extend the functionality to the PowerBI Web App, publish your dataset from the desktop version first, then pursue visualization construction within the web interface.
Congratulations! You've successfully imported your TikTok performance data into PowerBI and are well on your way to unlocking actionable insights and driving data-driven decision-making within your marketing efforts.
PowerBI can empower you to interpret TikTok data through various metrics available via Catchr's integration. Using such metrics allows deep dives into user engagement, content performance, and audience demographics. Transform numerical data into engaging and illustrative reports to present insights in a format that's easily digestible by stakeholders.
Here are examples of metrics you can analyze:
By integrating TikTok analytics within PowerBI, you can create custom dashboards that focus specifically on your marketing targets. Custom visuals and data transformations within PowerBI can take your reporting to the next level, allowing for rich context and benchmarking that elevates the decision-making process.
For the complete listing of TikTok fields and metrics available, visit Catchr's TikTok metrics page.
Start using Power BI with a ready-to-use template
Get the template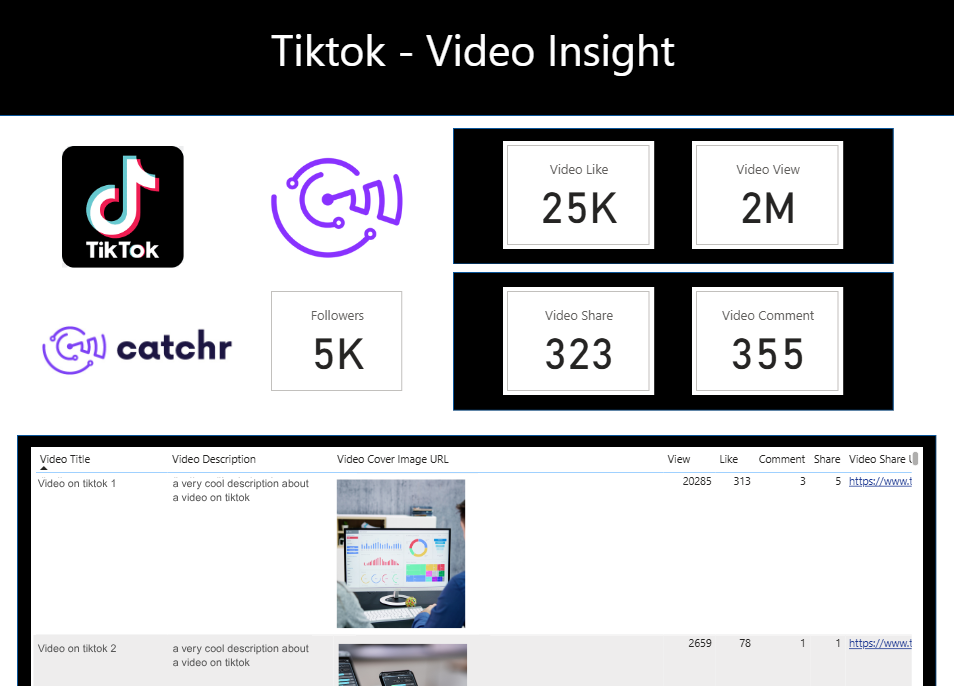
Start analyzing your data with a Power BI template
Catchr provides free dashboard templates to help you start analyzing your data on Power BI — 20+ available templates!
See all the Power BI templates


