Top N & segmentation filters in Power BI
Learn how to create a Top N chart in Power BI, apply Top N filters for marketing segmentation, avoid common ranking mistakes.
Top N filtering is how you answer common questions like “What are the top 10 campaigns by spend?” without drowning in long-tail noise. It helps you focus on what drives results, while keeping the logic consistent as your date range, market, and channel change.
Used well, Top N makes dashboards easier to read and easier to action. Used poorly, it can hide important context or surface noisy outliers.
What Top N filters are in Power BI
A Top N filter limits a visual to the top values of a category based on a measure. For example, you can show the Top 10 campaigns ranked by Spend, or the Top 5 channels ranked by Conversions.
Marketing teams use Top N because accounts naturally have long tails. A breakdown of 300 campaigns is rarely actionable, but a Top 10 view quickly shows concentration, winners, and budget drivers. Fields marketers commonly rank include Campaign, Channel group, Landing page, Country, Device, and Creative.
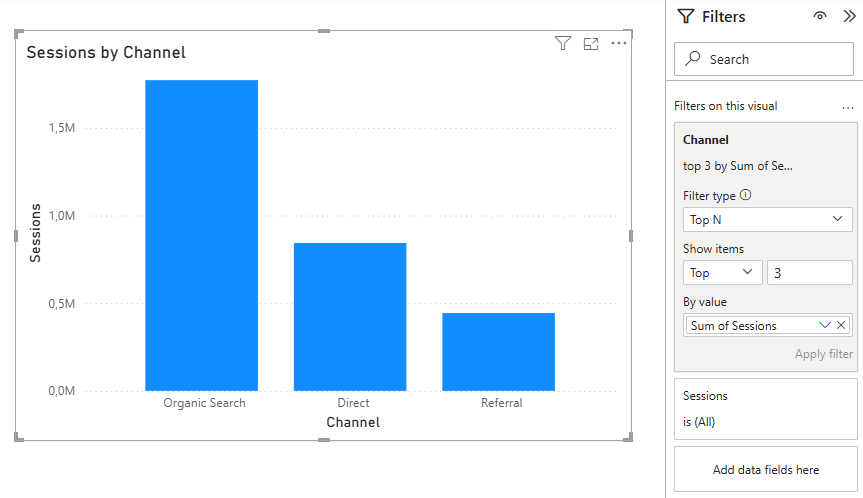
How to build a Top 10 chart in Power BI
This is a simple, marketer-friendly pattern for answering “Which channels drive the most impact?” without scanning a long list. Channel is just one example. You can use the same Top N approach with any categorical field, such as Campaign, Landing page, Country, Device, Source/Medium, or Conversion action.
- Add a bar chart visual and place Channel (or Channel group) on the axis.
- Add your ranking metric to Values, such as Spend or Conversions.
- In the Filters pane, under Filters on this visual, select the Channel field.
- Change the filter type to Top N and set Top = 3.
- In By value, drag the same measure you used in Values (Spend or Conversions).
- Apply the filter and sanity-check the result with your Date slicers.

Segmentation filters
Top N without segmentation can blend unlike things. A “Top campaigns” chart that mixes multiple markets, platforms, and time windows is rarely actionable.
Make segmentation explicit with:
- Date range
- Market or brand
- Channel group or platform
- Campaign type (for example Brand vs Non-brand)
A clean pattern is to use slicers for segmentation and Top N as a visual-level focus tool on the breakdown chart.
Go further with dynamic ranking in Power BI
Static Top N filters are a great starting point. The next step is making Top N dynamic so viewers can switch between “Top 5 / Top 10 / Top 20” and the ranking automatically adapts to the current slicers, such as Date and Channel.
Add a “Top N selector” slicer
Create a small table with values like 5, 10, and 20. Add it to the page as a slicer named “Show top”. You can then use that selection to control how many items appear in your ranking.
Next step (optional): Dynamic Top N with RANKX
Once the selector is in place, you can calculate a rank using DAX formulas for items like Channel, Campaign, or Landing page based on a measure such as Spend or Conversions. Then you keep only the items where Rank is less than or equal to the selected Top N.
Typical building blocks:
- A measure that reads the selected Top N value
- A rank measure (often using RANKX)
- A visual filter that keeps Rank ≤ selected Top N
Common Top N mistakes (and how to avoid them)
- Ranking by a ratio without guardrails: ROAS and CPA are useful, but they can be misleading at low volume. If you rank by a ratio, add a minimum spend or minimum conversions requirement.
- Making Top N global when it should be local: Top N is usually best as a visual-level filter. If you apply Top N at a page or report level, you can hide long-tail issues across multiple visuals without making it obvious.
- Not making the context explicit: rankings change when slicers change, and that is expected. Make it clear with a dynamic title like “Top campaigns by spend (US, last 28 days)”.
Conclusion
Top N filters help marketers focus on what matters without losing time in long lists. Use Top N at the visual level, pair it with clear segmentation, and be cautious when ranking by ratios unless you add volume guardrails.
Once static Top N feels comfortable, dynamic ranking is the next step. A simple Top N selector plus a rank measure gives you flexible views that adapt to the same slicers your team already uses.
.svg)