Interactions & cross-filtering: how to control analysis
Learn how Power BI interactions work, how to edit interactions (filter vs highlight), when visuals should not filter each other, and how to avoid misleading marketing analysis.
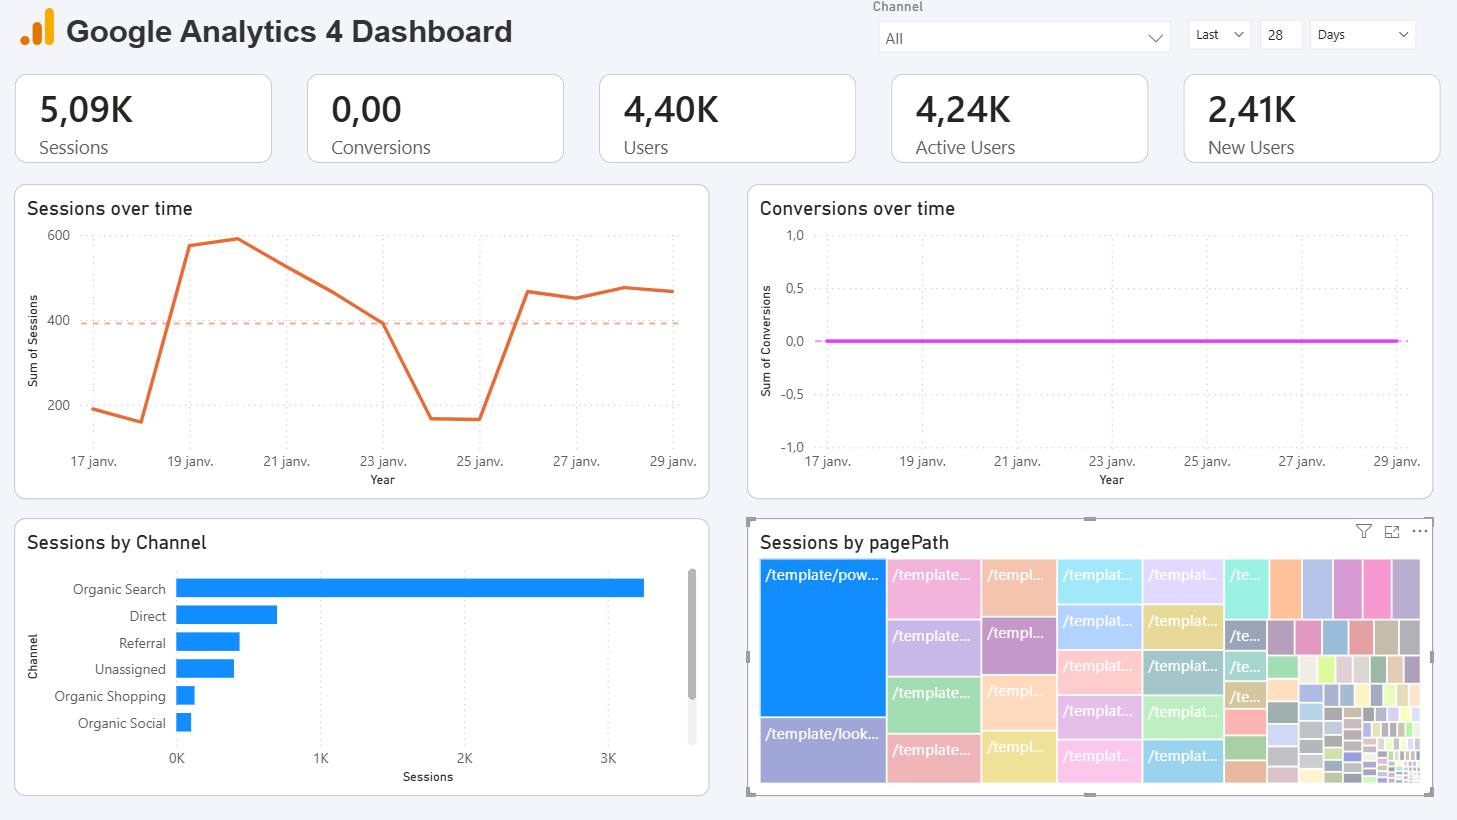
Cross-filtering is one of Power BI’s biggest strengths and one of the easiest ways to create misleading takeaways. This lesson shows how to control how visuals affect each other so exploration stays accurate for marketing dashboards.
What cross-filtering is in Power BI
Definition
Cross-filtering is when selecting a data point in one visual changes other visuals. It can either filter them (keep only matching data) or highlight them (emphasize matching data while keeping totals visible).
Marketers use it to investigate fast. Click “Paid Social” and immediately see which campaigns drove conversions, what happened to CPA over time, and whether one market dominates results. Fields that commonly drive interactions include Channel group, Platform, Campaign, Country, Device, and Funnel stage.
Edit interactions in Power BI (step by step)
Where it lives
In Power BI Desktop:
- Select a visual.
- Go to the Format ribbon (inside visualization pane).
- Choose Edit interactions.
- For each other visual, choose Filter, Highlight, or None.
Filter vs highlight
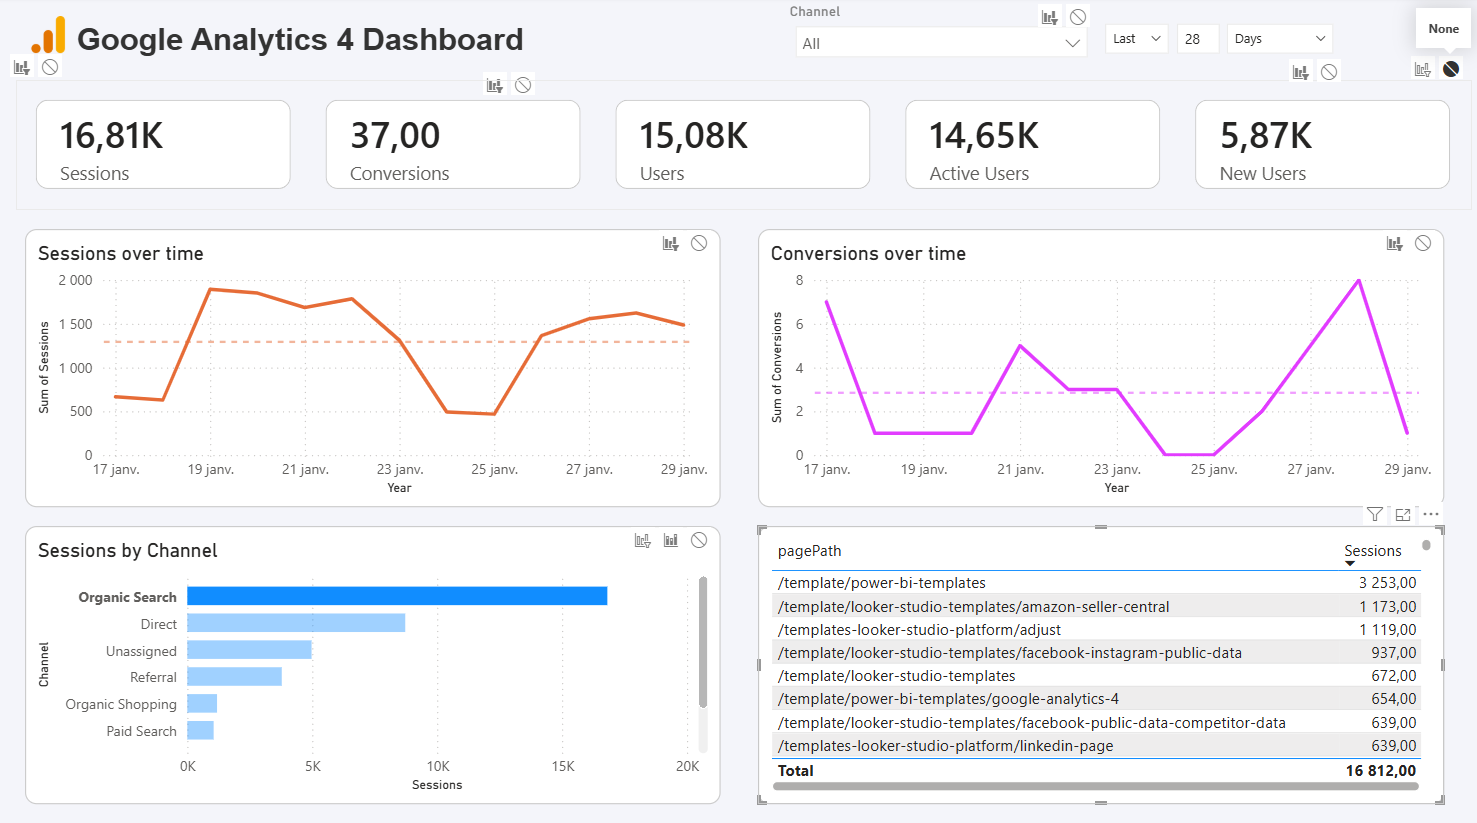
Filtering fully recalculates the target visual to the selected segment. Highlighting keeps the full context and visually emphasizes the selected segment.
For marketing pages, a practical pattern is to highlight trends (so the total baseline stays visible) and filter detail tables (so rows match the selection).
When visuals should not filter each other
Protect KPI cards from accidental clicks
KPI cards are easy to misread when they change based on an accidental selection. If someone clicks a channel bar and the headline ROAS changes, they may not realize they are looking at a subset.
A safe default is to disable interactions from detail visuals into KPI cards, unless you clearly label KPIs as contextual.
Be careful when visuals have different grains
If one visual is at Campaign grain and another is at Keyword grain, cross-filtering can create partial views that look complete but are not. This is a common source of “Power BI said X, but Google Ads said Y”.
If the grains do not align, consider using Highlight instead of Filter, disabling the interaction, or moving deeper exploration to drillthrough.
Avoid mixing platform logic unintentionally
If a report includes multiple platforms (GA4, Ads, CRM), cross-filtering across pages can unintentionally blend definitions. Keep platform pages logically separated unless your model is explicitly harmonized and documented.
Avoid misleading analysis
- Make selections visible: use clear slicer states, a short note, or a dynamic title like “Filtered to: Paid Social”.
- Protect executive KPIs from accidental filtering.
- Prefer highlight for trends when you want totals to stay visible.
- Disable interactions that create partial-period or partial-funnel views without explanation.
Conclusion
Cross-filtering is powerful, but only when it is intentional. Edit interactions so exploration supports analysis instead of silently changing the story, especially for KPI cards and visuals built on different grains. A strong default is to protect headline KPIs, use highlight when context matters, and push deeper exploration into drillthrough or dedicated detail pages.

.svg)