Filters in Power BI explained (for marketers)
Learn how to add filters in Power BI, understand visual vs page vs report filters, and follow filter pane best practices to keep marketing dashboards consistent.
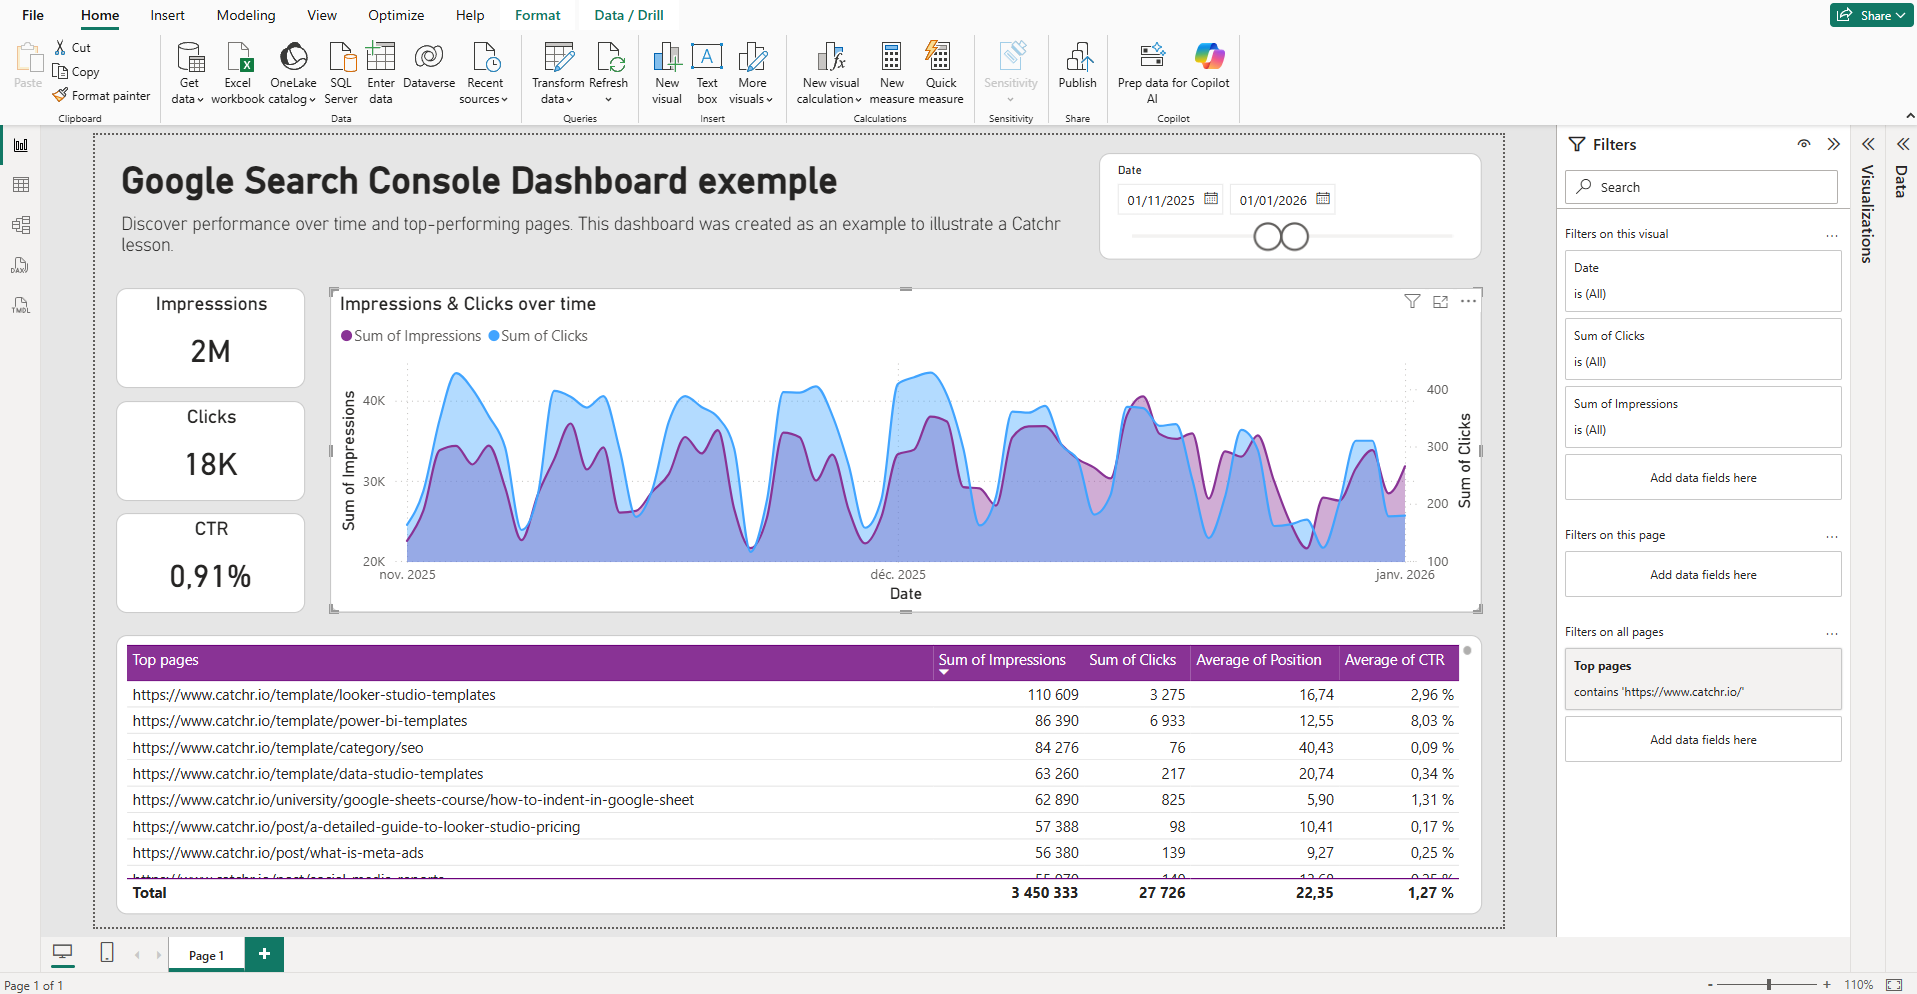
Filters are how you turn a “single source of truth” dataset into focused answers, like “ROAS last 7 days for Non-brand Search in the US”. In Power BI, filters also act as guardrails. They help you keep pages consistent so stakeholders do not compare numbers built on different definitions.
How filters work in Power BI
What a Power BI filter is
A filter is a rule that limits which rows of data are included in the calculation behind a visual. When the filter changes, your measures recalculate in that new context.
Marketing reporting is built on segmentation. Most day-to-day questions require you to narrow performance by channel, campaign, market, device, landing page, funnel stage, and a specific time window.
In practice, you will use this to exclude test campaigns, focus analysis on a single market, or dedicate an entire page to one platform, such as Google Ads.
Fields you typically use:
- Date (day, week, month)
- Channel / Source / Medium
- Campaign, ad group, keyword
- Country, region, device
- Conversion action, event name (GA4)
- Lifecycle stage, lead status (CRM)
Filters vs slicers in Power BI: what’s the difference?
Filters and slicers both limit the data used in visuals, but they are designed for different purposes.
Filters (in the Filters pane) are typically used for report logic and guardrails. They can be applied at the visual, page, or report level. In most marketing dashboards, they are pre-set by the report builder to keep definitions consistent, and they are often less visible to viewers. While filters can sometimes be adjusted by viewers, they are not the primary “interaction” layer you design for.
Slicers are interactive controls placed directly on the canvas. They are built for the viewer and make segmentation obvious and easy to change, which is ideal for marketers exploring performance by date range, market, channel, or campaign.
A practical rule:
- use filters for “this report should always…” (exclude test data, enforce market scope)
- use slicers for “let me explore…” (switch date ranges, choose channels, select a campaign).
From a UX perspective, slicers show the current selection by default, while filters can be easier to miss. If a filter materially changes how stakeholders interpret the numbers, consider surfacing that segmentation as a slicer or making it explicit in a dynamic title.
How to add filters in Power BI
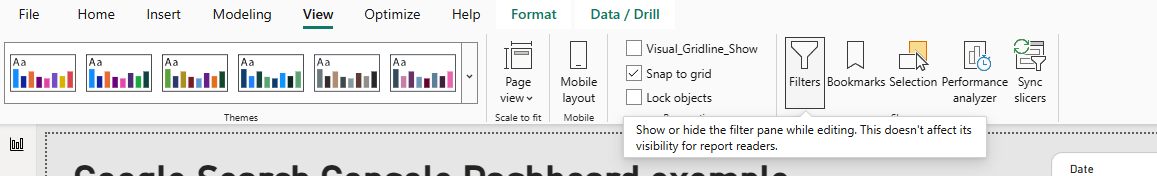
1) Open the Filters pane
If the Filters pane is not visible in Power BI Desktop, enable it from the View ribbon.
2) Choose the right scope first
Before you drag any field, decide what you want to affect:
- One chart only
- A full page
- The whole report
This is the difference between a quick exception and a definition that shapes every number in the file.
3) Drag a field into the right filter bucket
From the Fields pane, drag a column into one of these:
- Filters on this visual
- Filters on this page
- Filters on all pages
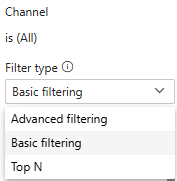
4) Configure the filter type (basic, advanced, top N)
- Basic filtering: select values like Channel = Paid Social.
- Advanced filtering: rules like “does not contain”, “is not blank”, numeric comparisons.
- Top N filtering: rules depending on the N best values of a metric.
5) Sanity-check the result
For marketing datasets, filter mistakes are often silent. Do a quick validation:
- Check whether “(Blank)” appears, which can signal missing tracking or broken relationships.
- Confirm you filtered the intended date field (for example Session Date vs Conversion Date).
- Spot-check with a table visual showing Date, Channel, Campaign, and the key metric.
Visual vs page vs report filters
Visual filters
Visual filters affect only the selected chart, table, or card. They are the cleanest way to make one element more specific without changing the story of the page.
For marketing dashboards, this is useful when a single visual needs extra hygiene, like excluding “(not set)”, removing internal campaigns, or focusing on one conversion action.
A typical setup is keeping page-level metrics broad, while a detail table is filtered to a subset that is easier to action.
Page filters
Page filters affect every visual on the current page, which makes them ideal when a page represents one clear question or workspace. In marketing reporting, pages often map to a platform or workflow, like “Google Ads performance”, “SEO dashboard”, or “CRM pipeline”. A page filter keeps KPI cards, trends, and breakdowns aligned to the same definition so stakeholders do not compare mismatched numbers on the same screen. This is also a good place to apply a consistent market, brand, or channel grouping when that page is intended for a specific audience.
Report filters
Report filters affect every page in the report and should act as governance, not analysis. They are best for rules that you want to be true everywhere, like excluding test campaigns, removing internal traffic, or restricting a report version to a specific region. For marketers, this improves trust because it reduces the risk of someone reading a page that quietly includes “junk” data or irrelevant markets. Report filters also help when the same report is shared across teams, since they enforce shared definitions across all tabs.
Filter pane best practices in Power BI
Use report filters for non-negotiable rules
Report filters are best for governance. If the rule should almost always be true, put it here.
Examples that work well:
- Exclude test campaigns
- Exclude internal traffic
- Include only “Marketing-sourced” leads for a marketing pipeline report
Keep user-controlled segmentation visible
If marketers should change a segment often, prefer slicers over hidden pane filters. A report can be “correct” and still feel confusing if the key segmentation is not obvious.
Avoid “fixing” data issues by filtering them away
If you see “(Blank)” or unexpected values, treat it like a tracking or modeling signal first. Filtering it out can make dashboards look cleaner while hiding real pipeline issues.
Standardize fields before filtering at scale
If you combine datasets from multiple sources, inconsistent naming creates filter chaos. Standardize columns in Power Query where possible so users are not choosing between three different “Campaign” fields.
When you discuss automation and reliable refresh for multi-source marketing reporting, it can be helpful to mention that connector layers like Catchr can reduce manual exports and keep datasets consistent. Keep it as a tip, not a pitch.
Conclusion
Filters are your reporting guardrails. Use report filters for non-negotiable rules (like excluding test data), page filters to keep a page’s story consistent, and visual filters for targeted exceptions.
Before you share the report, do a quick trust check: verify the filter scope, look for unexpected blanks, and confirm you filtered the right date field. Clean, consistent filtering is what makes a marketing dashboard feel reliable week after week.
.svg)