Measures vs calculated columns in Power BI
Learn the difference between measures and calculated columns in Power BI and know when to use each for marketing KPIs and dashboards.
One of the most common points of confusion in Power BI is the difference between measures and calculated columns. Power BI lets you create both, but choosing the wrong one often leads to incorrect KPIs, poor performance, or dashboards that don’t behave as expected.
In this article, we’ll explain what measures and calculated columns really are, how they differ, and when you should use one or the other.
What is a measure in Power BI?
Measures explained in simple terms
A measure is a calculation that is evaluated dynamically, based on the filters, slicers, and context of a visual. It is not stored in a table. Instead, Power BI recalculates it every time the context changes.
Because measures react to context, the same measure can return different values depending on date ranges, campaigns, channels, or any other filter.
Typical marketing measures
Measures are where KPIs truly belong. Common marketing examples include:
- Total sessions
- Total clicks
- Conversion rate
- ROAS
- CAC
These metrics need to adapt automatically to filters such as time, channel, or campaign, which makes measures the right tool.
What is a calculated column?
Calculated columns explained
A calculated column is computed row by row when the data is loaded or refreshed. The result is stored directly in the table, just like a regular column coming from the source.
Once calculated:
- the value does not change based on filters
- it behaves like static data
Typical marketing use cases for calculated columns
Calculated columns are useful when you need to enrich or categorize data, not calculate KPIs. Common examples include:
- Grouping campaigns into categories (Brand vs Non-brand)
- Labeling traffic sources
- Creating flags such as “Paid vs Organic”
- Extracting or standardizing values for filtering
These values describe each row and do not need to change dynamically.
Measures vs calculated columns: key differences
This distinction is fundamental to understanding how Power BI works.
How to create a measure or a calculated column in Power BI
How to create a measure in Power BI
- Go to Report view.
- In the Fields pane, right-click the table where you want to store the measure.
- Click New measure.
- Give the measure a clear, business-oriented name (for example: Total Sessions or ROAS).
- Define the calculation using DAX.
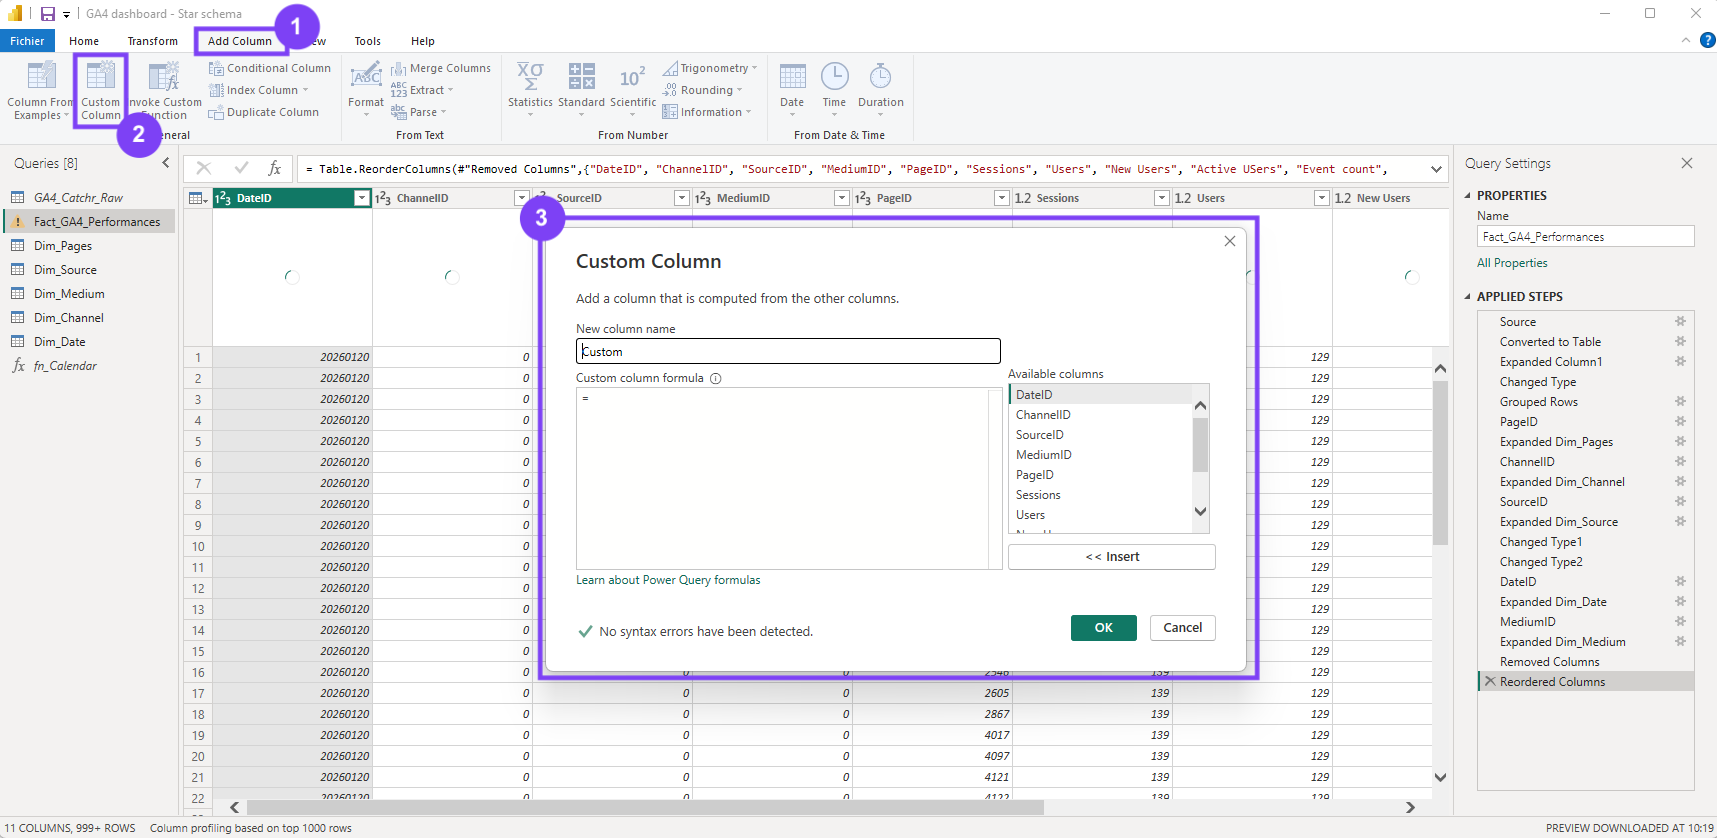
How to create a calculated column in Power BI
- Go to Data (Table) view.
- Select the table you want to enrich.
- Right-click the table (or use the ribbon) and choose New column.
- Give the column a clear name (for example: Channel group or Campaign category).
- Define the row-level logic for the column.
Common mistakes
A few mistakes appear frequently when starting with Power BI:
- Creating KPIs as calculated columns instead of measures
- Calculating rates or ratios row by row
- Duplicating KPI logic across multiple visuals
- Using calculated columns for aggregations that should respond to filters
These issues often lead to incorrect numbers and dashboards that are hard to maintain.
Conclusion
Measures and calculated columns serve very different purposes in Power BI. Measures define dynamic KPIs that adapt to filters and context, while calculated columns add static structure to your data.
For marketers, most performance metrics should be measures, while columns should be used to classify and organize data. Making the right choice keeps your semantic model clean, your dashboards accurate, and your reporting scalable.

.svg)