Star schema for marketing data in Power BI
Learn what a star schema is in Power BI, understand fact and dimension tables, and see how marketers can structure data for reliable KPIs and dashboards.
Many reporting issues in Power BI don’t come from visuals or formulas, but from how data is structured. When tables are poorly organized or overly flat, filters behave unexpectedly, KPIs become hard to trust, and dashboards don’t scale well.
The star schema is the most common and reliable data modeling pattern used in Power BI. Understanding how it works will help you build cleaner models, more reliable dashboards, and more consistent KPIs.
What is a star schema?
A star schema is a way of organizing data where one central table is connected to several surrounding tables. Visually, it looks like a star.
The central table contains performance data, while the surrounding tables provide context. Filters flow from the outer tables to the central one, making analysis predictable and easy to control.
Fact tables vs dimension tables
Before diving into examples, it’s important to understand that a star schema is built on two complementary types of tables. Each plays a very different role in how Power BI stores, filters, and aggregates marketing data. Distinguishing between fact tables and dimension tables helps explain why some models behave predictably while others quickly become hard to manage.
Fact tables: what happened
Fact tables store measurable, quantitative data. They usually contain many rows and grow quickly over time.
In a marketing context, fact tables typically include:
- ad performance (clicks, cost, conversions)
- website activity (sessions, users, events)
- transactions or revenue data
Each row represents an observation, such as performance for a campaign on a given day.
Dimension tables: context and structure
Dimension tables describe the facts. They contain descriptive information used for filtering, grouping, and slicing data.
Common marketing dimensions include:
- campaigns
- dates
- channels
- countries or regions
- products or categories
Dimension tables usually have fewer rows and change less frequently than fact tables.
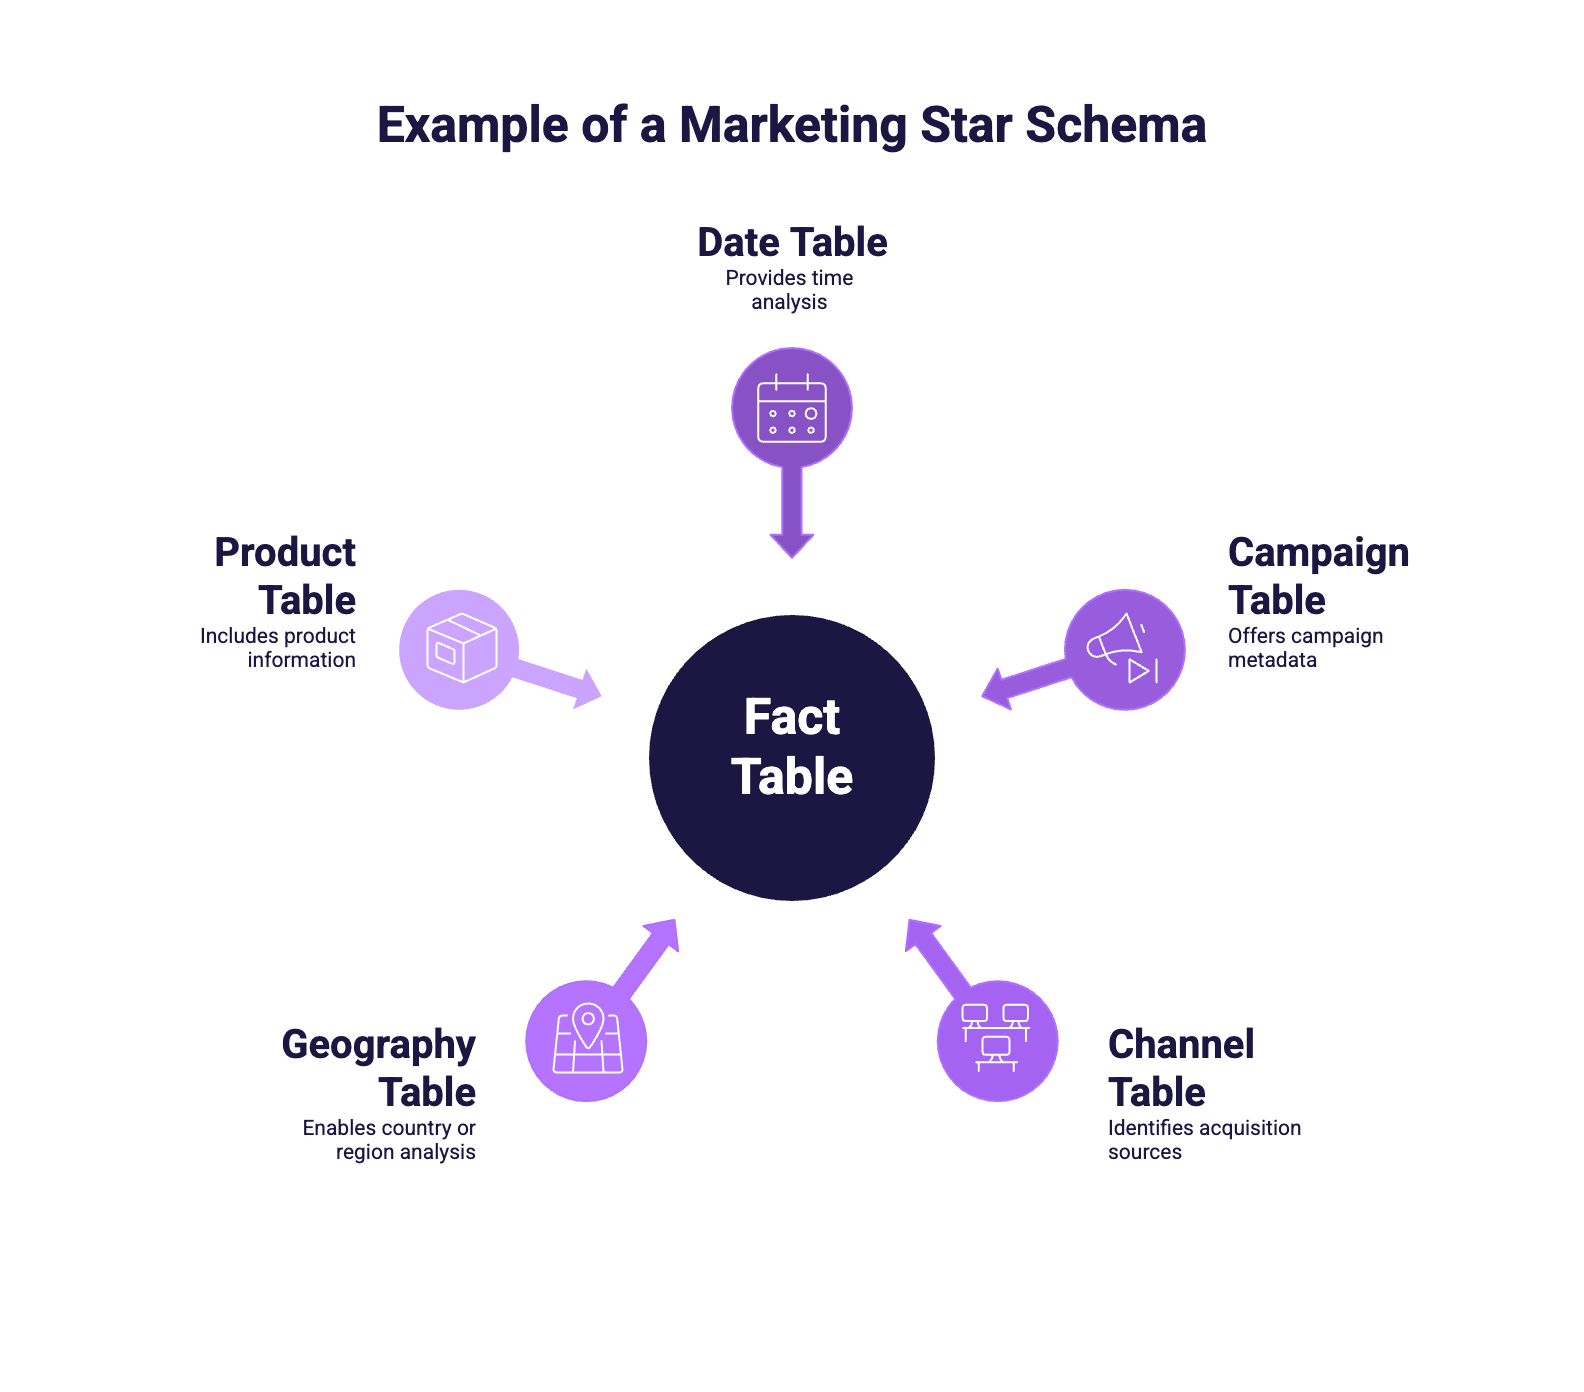
A typical star schema for marketing data
A classic marketing star schema looks like this:
At the center, a fact table contains daily performance metrics such as clicks, impressions, cost, conversions, and revenue.
Around it, dimension tables provide context:
- a Date table for time analysis
- a Campaign table for campaign metadata
- a Channel table for acquisition sources
- a Geography table for country or region analysis
- optionally a Product or Account table
Each dimension connects to the fact table through a shared key and a relationship defined in the model. Thanks to this relationship, filters applied on dimensions automatically propagate to the metrics stored in the fact table.
How to structure a marketing star schema (practical steps)
Although the exact implementation depends on the data source, the overall process is consistent across most marketing use cases.
1. Extract and consolidate the data
Data is first pulled from marketing platforms using a connector or export and loaded into Power BI. At this stage, all required metrics and analysis dimensions are combined into a single staging table using Power Query. Typical operations include column selection, renaming, and basic type transformations.
2. Identify dimensions and create dimension tables
Based on how performance is analyzed (date, campaign, channel, country, product, etc.), dimension tables are created by duplicating the staging query and keeping only the relevant columns. In Power Query, this mainly relies on Remove Other Columns and Remove Duplicates.
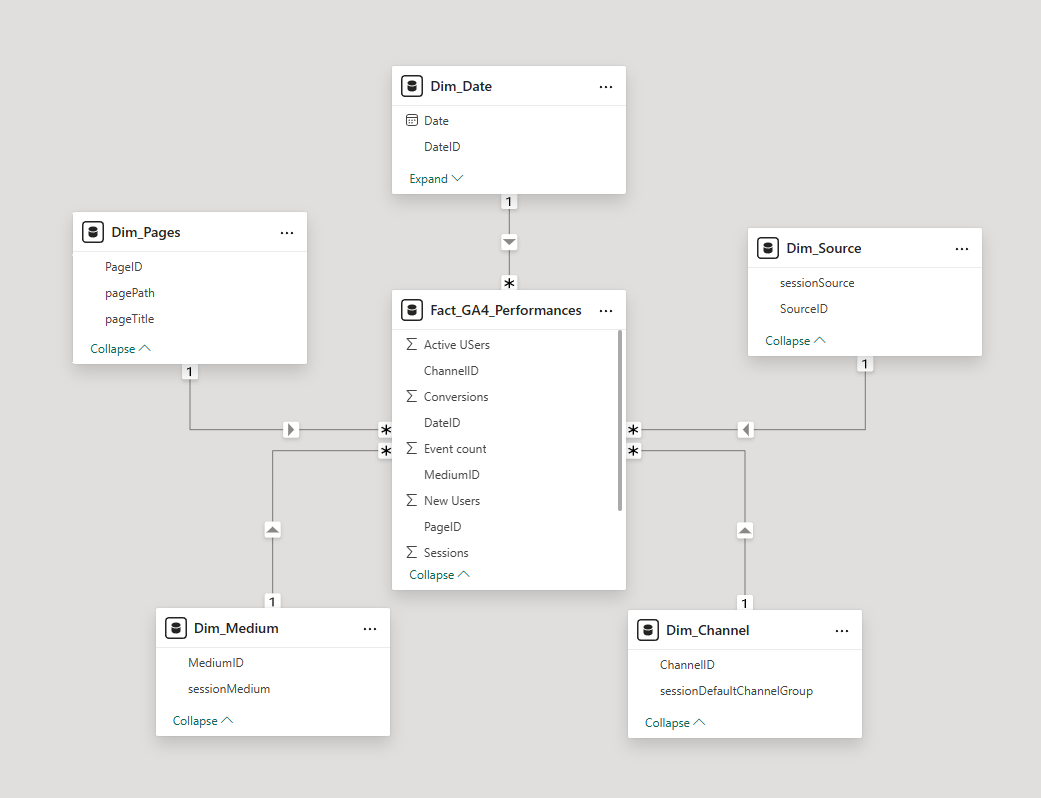
3. Generate surrogate IDs for dimensions
Each dimension table is assigned a stable surrogate key. This is done in Power Query using Add Column > Index Column. These IDs serve as primary keys and will be used to create relationships with the fact table.
4. Build the fact table
The fact table is created by keeping only performance metrics and replacing descriptive fields with dimension IDs. This step is implemented using Group By (to control the grain) and Merge Queries to join dimension tables and retain only their IDs.
5. Define relationships and measures
In the data model, each dimension is connected to the fact table using one-to-many relationships. The original staging table is hidden or excluded from the model. Business logic is then implemented using DAX measures rather than calculated columns.
This approach provides a clear separation between data preparation, modeling, and analysis, making the model easier to maintain and extend over time.
Why star schema matters in Power BI
Common modeling mistakes marketers make
Some frequent pitfalls include:
- joining multiple fact tables directly together
- embedding descriptive fields inside large fact tables
- relying on many-to-many relationships everywhere
- using a single flat table for all reporting needs
These patterns often work at first, but they lead to incorrect numbers, poor performance, and fragile dashboards as reporting grows.
Conclusion
The star schema is not a rigid rule, but a proven guideline for structuring data in Power BI. For marketers, understanding this pattern helps explain why some dashboards feel reliable while others don’t.
By separating performance data from contextual dimensions, star schemas make KPIs easier to trust, dashboards easier to scale, and reports easier to maintain over time.

.svg)