Power BI Relationships Explained
Learn how Power BI relationships work for marketing data, including cardinality types, cross-filter direction, and active vs inactive relationships.
In Power BI, relationships define how tables interact with each other. They control how filters propagate, how metrics are aggregated, and ultimately whether your KPIs are correct or misleading.
For marketing teams, relationship issues are one of the most common sources of silent errors. Dashboards may look fine, but numbers can be wrong simply because relationships are misunderstood or misconfigured. This article explains how relationships work in Power BI, the main types you’ll encounter, and how to avoid common mistakes.
What are relationships in Power BI?
In Power BI, relationships are the links between tables. They’re created when two tables share a common key, such as a date, campaign ID, or account ID, and they tell Power BI how data should be combined and how filters should propagate.
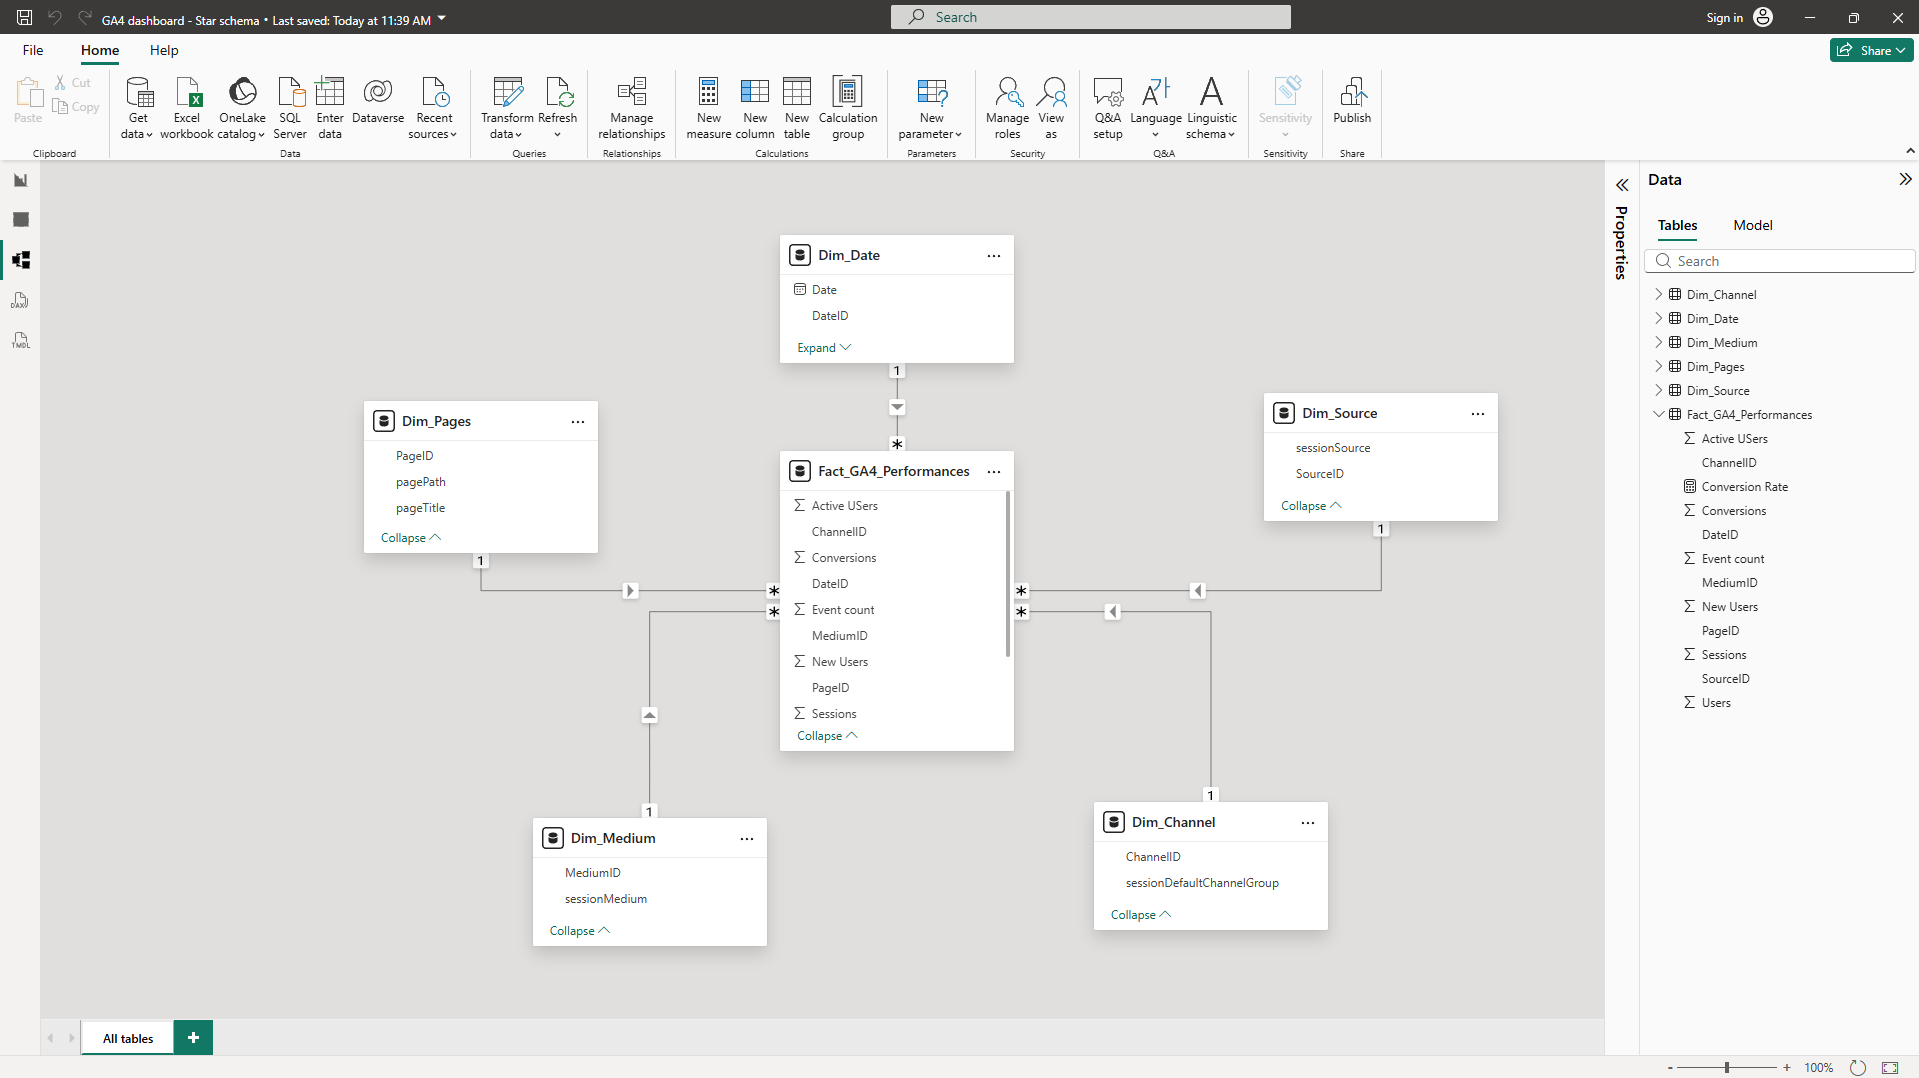
You’ll mainly see and manage relationships in the Model view, where tables are connected by lines. Power BI may create some relationships automatically, but it’s important to review them, because relationships directly determine whether your KPIs react correctly when you filter by date, campaign, channel, or country.
How relationships work in Power BI
A relationship connects two tables through a shared key and defines how filters move between them. When a filter is applied to one table, Power BI uses relationships to determine which rows in other tables should be included.
In a marketing context, relationships are what make it possible to filter performance metrics by date, campaign, channel, country, or any other dimension. Without correct relationships, KPIs lose their meaning.
One-to-many relationships (the default and safest option)
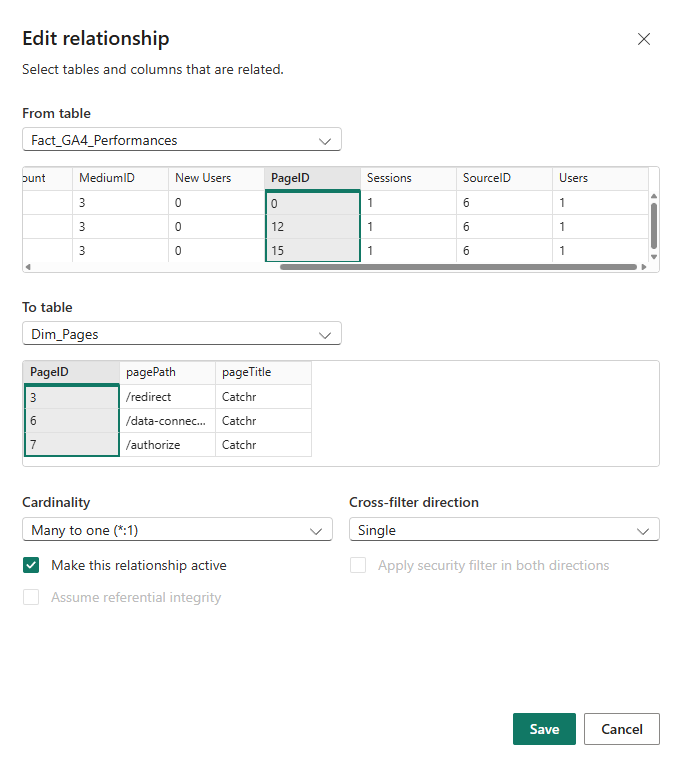
A one-to-many relationship is the most common and recommended relationship type in Power BI. It means that one row exists on the “one” side (usually a dimension table), while many rows exist on the “many” side (usually a fact table). Filters flow from the one side to the many side.
In the Power BI interface, you may also see this relationship displayed as many-to-one, depending on which table is selected first. Both represent the same underlying structure and behave identically.
Typical marketing examples include:
- Date → daily performance data
- Campaign → ad performance
- Channel → sessions or conversions
Many-to-many relationships (use with caution)
A many-to-many relationship occurs when both tables contain multiple rows for the same key.
While Power BI supports this type of relationship, it often introduces ambiguity:
- Filters may apply in unexpected ways
- Totals can be duplicated or inflated
- KPI logic becomes harder to reason about
Marketing scenarios that can trigger many-to-many relationships include:
- Campaigns associated with multiple tags or categories
- Users belonging to multiple segments
In many cases, many-to-many relationships are a signal that the data model needs to be restructured, often by introducing a proper dimension table or adjusting granularity.
One to one (1:1)
A one-to-one relationship means:
- Each row in one table matches exactly one row in the other table
This is less common in marketing, but it can happen when:
- A table is split for technical or organizational reasons
- Additional attributes are separated into a secondary table
Because both tables have the same granularity, this relationship is usually safe, but often unnecessary unless there is a clear reason to separate the data.
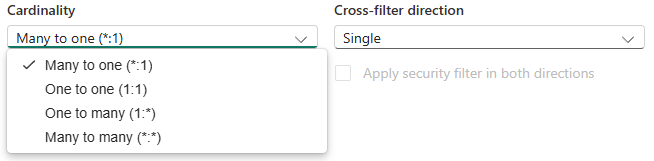
Relationship cardinality recap
Cross-filter direction (how filters propagate)
Cross-filter direction determines how filters move between tables.
- Single direction means filters flow from the dimension table to the fact table.
- Both directions allow filters to flow both ways between tables.
Single direction is recommended in most marketing models because it is:
- easier to understand
- less error-prone
- aligned with star schema logic
Bidirectional filtering can be useful in specific scenarios, but it also increases the risk of ambiguous filter paths and unexpected results.
Active vs inactive relationships
Power BI allows multiple relationships between the same tables, but only one can be active at a time.
- Active relationships are used automatically by visuals
- Inactive relationships exist in the model but are ignored unless explicitly activated in a measure
Marketing examples include:
- Click date vs conversion date
- Order date vs attribution date
Inactive relationships are not a problem by themselves, but they require deliberate use and clear intent.
You can quickly manage relationships from the Properties tab.
Common relationship mistakes marketers make
Some mistakes appear frequently in marketing dashboards:
- Linking fact tables directly together
- Using many-to-many relationships without understanding the impact
- Enabling bidirectional filtering to “fix” incorrect numbers
- Assuming that matching column names automatically creates a relationship
These issues rarely cause visible errors, but they often lead to incorrect KPIs and misleading insights.
Conclusion
Relationships are one of the most powerful and least visible components of Power BI. They define how data is combined, filtered, and aggregated across your dashboards.
For marketing teams, sticking to simple principles, one-to-many relationships, single-direction filtering, and clear keys, prevents most issues before they happen. Understanding relationships is not about technical perfection, but about protecting the accuracy and trustworthiness of your KPIs.
.svg)