Date tables and time intelligence in Power BI
Learn why a date table is essential in Power BI, how it enables reliable time intelligence, and how marketing teams should use it for consistent reporting.
Time-based analysis sits at the heart of almost every marketing dashboard. Comparing performance over time, tracking trends, and measuring growth all depend on how dates are handled in your data model.
In Power BI, reliable time analysis requires more than just a date column in your data. A proper date table is the foundation that makes time filtering, comparisons, and future time intelligence calculations work consistently.
Why you need a Date table in your model
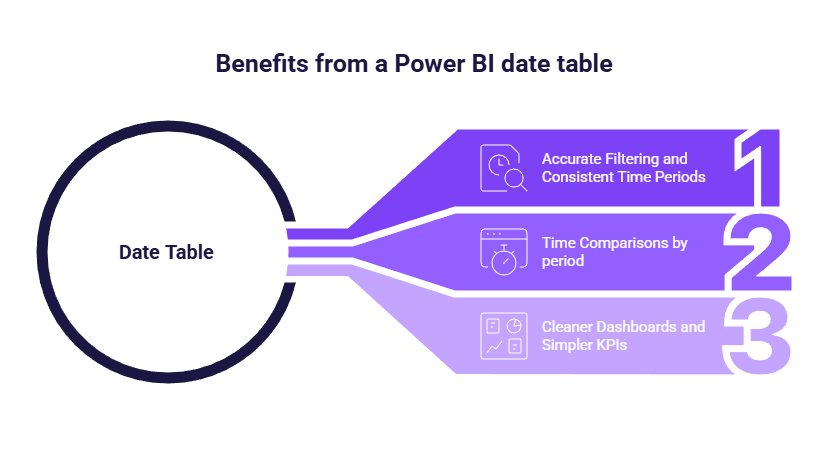
Accurate filtering and consistent time periods
Without a dedicated date table, Power BI relies on dates embedded directly in your fact tables. This often leads to inconsistencies, especially when working with multiple data sources or different date formats.
A date table centralizes all time logic in one place. It ensures that weeks, months, quarters, and years are defined consistently across all dashboards, regardless of the source data.
This avoids common issues such as:
- months displayed alphabetically instead of chronologically
- inconsistent week definitions
- filters behaving differently from one report to another
Time comparisons marketers actually need
Marketing analysis is rarely about raw daily values. Teams need to compare performance across meaningful time periods.
A proper date table makes it much easier to build:
- month-over-month comparisons
- year-over-year analysis
- rolling 7, 28, or 30-day metrics
- year-to-date or quarter-to-date views
These comparisons become more reliable and easier to maintain when all reports rely on the same time dimension.
Cleaner dashboards and simpler KPIs
With a single shared date table, dashboards become easier to build and maintain. Instead of managing time logic in every visual, you reuse the same fields everywhere.
This leads to:
- cleaner report structures
- simpler measures later on
- fewer inconsistencies across dashboards
How to create a date table in Power BI
Option 1: Create a date table with DAX (recommended)
The fastest and most common approach is to create a date table directly in Power BI using DAX.
From Power BI Desktop:
- Go to Modeling
- Click New table
- Create a calendar using DAX
DateTable =
VAR MinDate = DATE(2024, 1, 1)
VAR MaxDate = DATE(2028, 12, 31)
RETURN
ADDCOLUMNS (
	CALENDAR ( MinDate, MaxDate ),
    "Year", YEAR ( [Date] ),
    "Month Number", MONTH ( [Date] ),
    "Month Name", FORMAT ( [Date], "MMMM" ),
    "Week Number", WEEKNUM ( [Date], 2 ),
    -- 2 = week starts on Monday (ISO-like)
    "Quarter", "Q" & FORMAT ( [Date], "Q" )
)
Once created, you typically add columns such as:
- Year
- Month number
- Month name
- Week number
- Quarter
This table will act as the single time reference for all reports.
Option 2: Create a date table in Power Query (alternative)
A date table can also be created in Power Query, especially if you prefer transformations over DAX. This approach works well but is less common for beginners.
- Open Power Query by selecting Transform Data.
- Click the arrow below the New Source button to open the drop-down menu.
- Select Blank Query.
- In the ribbon, open Advanced Editor and paste the code below.
- Press Enter to validate, then simply rename the query/table as needed.
let
	// Parameters
	MinDate = #date(2015, 1, 1),
    MaxDate = #date(2030, 12, 31),

    // Create list of dates
    DateList = List.Dates(
    	MinDate,
        Duration.Days(MaxDate - MinDate) + 1,
        #duration(1, 0, 0, 0)
        ),

     // Convert to table
     DateTable = Table.FromList(
     	DateList,
        Splitter.SplitByNothing(),
        {"Date"}
        ),

      // Add date attributes
      AddYear = Table.AddColumn(DateTable, "Year", each Date.Year([Date]), Int64.Type),
      AddMonthNumber = Table.AddColumn(AddYear, "Month Number", each Date.Month([Date]), Int64.Type),
      AddMonthName = Table.AddColumn(AddMonthNumber, "Month Name", each Date.MonthName([Date]), type text),
      AddWeekNumber = Table.AddColumn(AddMonthName, "Week Number", each Date.WeekOfYear([Date], Day.Monday), Int64.Type),
      AddQuarter = Table.AddColumn(AddWeekNumber, "Quarter", each "Q" & Text.From(Date.QuarterOfYear([Date])), type text)

in

      AddQuarter
Regardless of the method, the goal is the same: one clean table that contains one row per date and all relevant time attributes.
Mark the table as a Date table (critical step)
Why marking the date table matters
Creating a date table is not enough. Power BI must know that this table is the official time reference for your model.
Marking the table as a Date table:
- enables proper time intelligence behavior
- prevents Power BI from guessing which date column to use
- improves consistency across measures and visuals
How to mark a table as a Date table
- Select your date table
- Go to Table tools
- Click Mark as date table
- Choose the main Date column
Connect the date table to your fact tables
The correct relationship setup
A date table should always sit on the one side of a one-to-many relationship.
- Date table → one row per date
- Fact tables → many rows per date
Filters should flow from the date table to the fact tables using a single-direction relationship.
When you have multiple date fields
Marketing data often includes more than one date:
- click date vs conversion date
- created date vs closed date (CRM)
In this case:
- keep one active relationship to the main analysis date
- keep other relationships inactive
Common date table mistakes in marketing dashboards
Some issues appear frequently when date tables are missing or misused:
- relying on text month names without a numeric sort column
- creating multiple date tables across reports
- not covering the full date range needed for future planning
- mixing different time zones without aligning dates
These problems don’t always cause visible errors, but they often lead to confusing or misleading trends.
Conclusion
A date table is the backbone of time-based analysis in Power BI. It brings consistency, clarity, and reliability to marketing dashboards.
By creating one proper date table, marking it correctly, and linking it cleanly to your fact tables, you establish a strong foundation for all future reporting. This small upfront effort pays off quickly as dashboards grow and time-based questions become more complex.

.svg)