Power Query essentials settings to clean your data
Learn the essential Power Query transformations marketers need to clean, structure, and prepare marketing data in Power BI efficiently.
Marketing data exports are rarely ready for analysis. They often contain too many columns, inconsistent formats, combined fields, or values that don’t behave correctly in reports. Power Query is where marketers can fix these issues once and let Power BI handle them automatically at every refresh.
In this article, we’ll cover the essential Power Query transformations that solve most day-to-day data problems, without technical complexity or code.
Essential transformations every marketer should know
Remove columns, filter rows, and sort data
Most marketing platforms export far more data than you actually need. Removing unnecessary columns early makes datasets lighter, easier to understand, and easier to maintain.
Filtering rows is equally important. You may want to focus on a specific channel, country, campaign type, or date range, especially when validating data. Sorting data by date or performance metrics is often used as a quick sanity check.
- Click Transform data in the top ribbon to open Power Query.
- Select the query you want to edit.
- Remove unnecessary columns by selecting the column, then clicking Remove Columns in the ribbon.
- Filter rows (for example, exclude “(not set)”) by clicking the filter arrow next to the column header.
- Sort the data if needed to quickly validate that your changes look correct.
Change data types (dates, numbers, text)
Correct data types are critical in Power BI. Power Query automatically guesses data types, but those guesses are not always correct.
Common marketing issues include:
- Dates imported as text, which breaks time filtering
- Numeric values treated as text because of currency symbols or separators
- Percentages not recognized as numbers
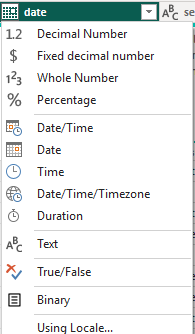
How to change data types in Power BI?
This action is very quick and simple if your data doesn't have character problem:
- Click the icon, left to the name of your column
- Select the type of data you need
Split columns and replace values
Marketing data often contains combined fields or inconsistent naming conventions. Splitting columns allows you to turn one field into multiple usable dimensions.
Typical examples include:
- Splitting campaign names into channel, country, or objective
- Separating UTM parameters
- Breaking URLs into domain and path
Replacing values is just as useful. It helps standardize naming, such as turning FB into Meta, or cleaning inconsistent capitalization and extra spaces.
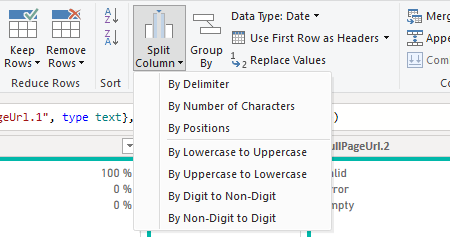
- Select the column you want to split.
- Click Split Column in the ribbon.
- Choose how you want to split the column (by delimiter, by number of characters, or by position).
Extract text from fields
Text extraction lets you pull specific parts of a value without complex formulas. You can extract text before, after, or between specific characters.
This is especially useful for:
- Extracting domains from URLs
- Pulling campaign IDs from structured names
- Isolating dates or tags embedded in text
In this example, we keep only the path of URLs by extract the domain (by selecting after delimiter "/").
- Select the column you want to work with.
- Go to the Transform tab.
- Click Extract.
- Choose the extraction option you need (for example Text Before Delimiter, Text After Delimiter, or Text Between Delimiters).
Rename your column and steps
After applying transformations, take a moment to rename your columns and applied steps. Clear names make it easier to understand what each column represents and to quickly see when and why a change was applied, especially as your query grows or when someone else reviews your work.
How these transformations work together
All transformations in Power Query are applied as sequential steps. Each step builds on the previous one, and Power BI replays them automatically every time data is refreshed.
This means you clean your data once, and the same logic applies to all future updates. The order of steps matters, but the process itself is deterministic and reproducible, which is a major advantage over manual Excel edits.
Recommended order to apply steps in power Query
Remove unnecessary columns early
Start by keeping only the fields you actually need. This reduces noise and makes every next step easier to understand and maintain.
Change data types as soon as possible
Fix dates, numbers, and text early. Correct data types ensure that filters, sorting, and later transformations behave as expected.
Filter rows when relevant
Apply filters once the structure is clean, for example to focus on a specific channel, country, or time range.
Split columns and extract text
Once data types are correct, reshape fields by splitting combined values or extracting useful parts from text.
Replace values and standardize naming
Clean inconsistencies and normalize labels after the structure is in place.
Sort data for validation (optional)
Sorting is usually used as a final check to visually validate the results rather than as a core transformation.
Common mistakes to avoid in Power Query
When starting out, it’s easy to fall into a few traps:
- Applying too many transformations at once without checking results
- Forgetting to validate data types early
- Cleaning data manually instead of using Power Query steps
- Overcomplicating transformations before understanding the basics
Keeping transformations simple and intentional leads to more reliable dashboards.
Conclusion
These Power Query essentials cover the majority of data preparation needs for marketing teams. By learning how to remove noise, fix data types, clean text, and structure fields properly, marketers can turn raw exports into reliable datasets that refresh automatically. Mastering these basics makes Power BI reporting more stable, scalable, and far less dependent on manual work.
.svg)