Differences between Power BI Desktop and Service
Power BI Desktop vs Power BI Service: a complete guide to what they are, what they’re used for, and when to use each one.
If you’re new to Power BI, one of the first questions you’ll face is the difference between Power BI Desktop and Power BI Service. Both are part of the same ecosystem, but they serve different purposes and are used at different stages of the reporting workflow.
What is Power BI Desktop?
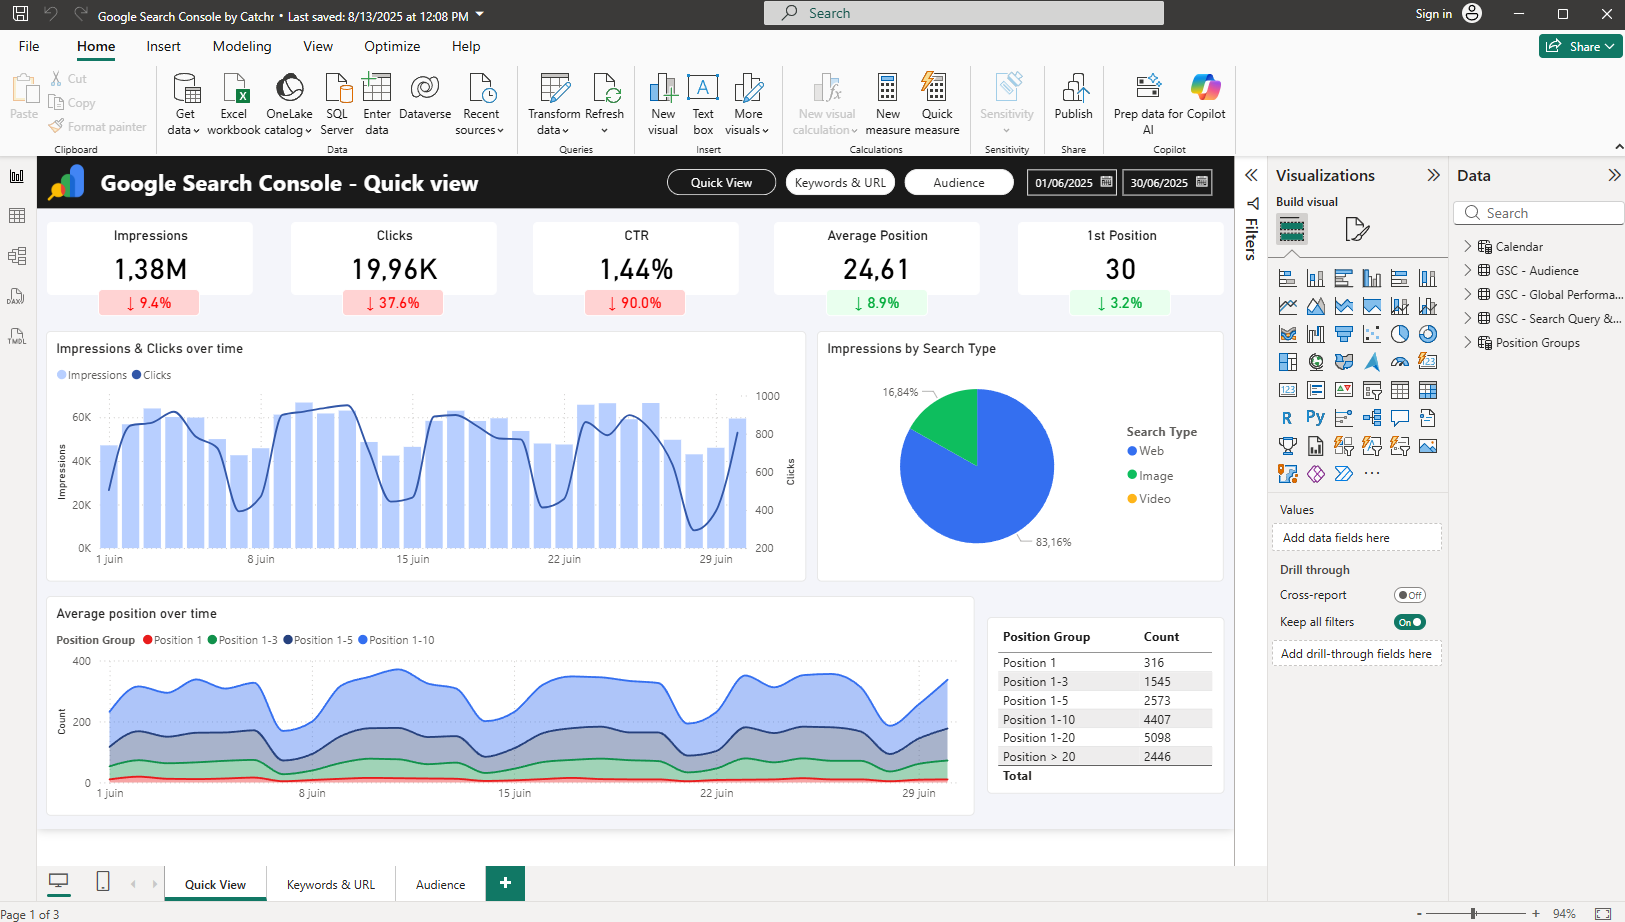
Power BI Desktop is a Windows application used to create Power BI reports. It’s where you connect to data, shape it, model it, and design your report pages.
In Power BI Desktop, you typically:
- Connect to data sources (files, databases, online services)
- Clean and transform data (Power Query)
- Build a data model (tables, relationships, date table)
- Create KPIs and calculations (measures)
- Design report pages (charts, tables, filters)
Power BI Desktop runs locally on your computer and is free to use, which makes it the starting point for most marketers who want to build dashboards. However, you will quickly be limited if you want to publish or share your reports, as these features require a paid license. We have already published a dedicated article explaining Power BI pricing in detail.
What is Power BI Service?
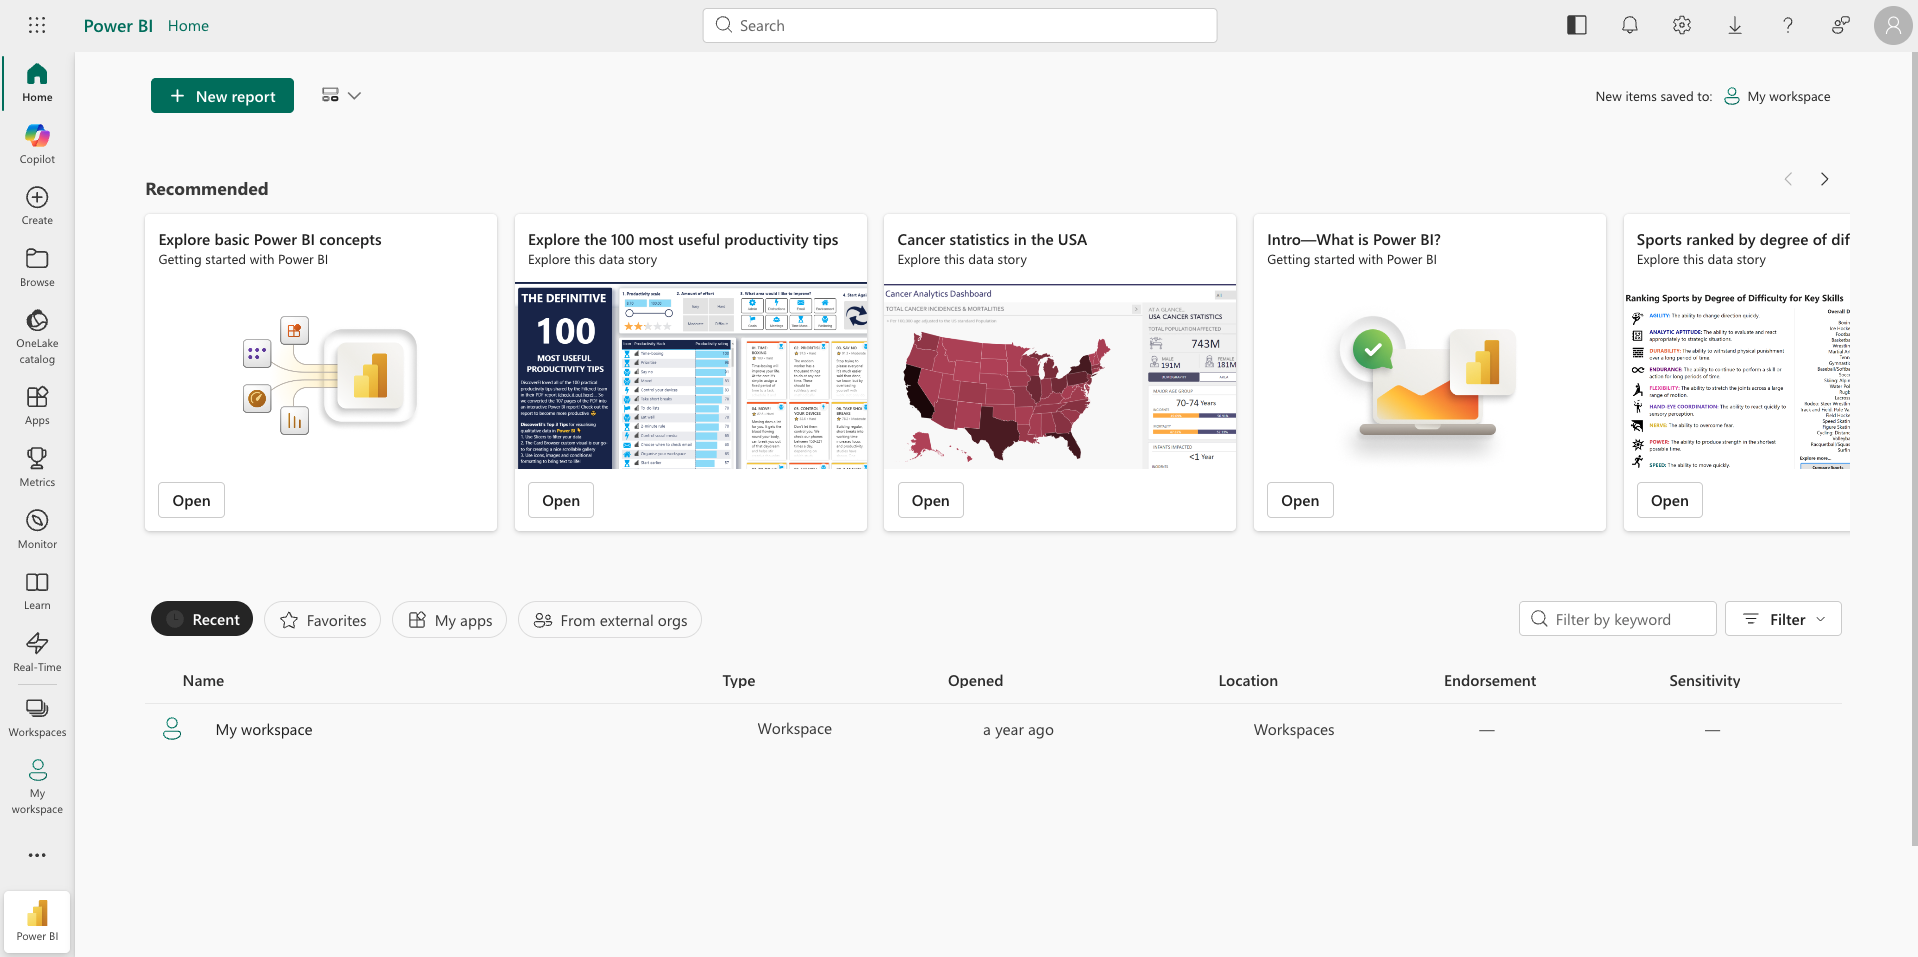
Power BI Service is the cloud platform where Power BI content lives once it has been published. It is accessed through a browser and is designed for collaboration, sharing, and report operations.
In Power BI Service, marketing teams typically:
- Publish reports from Desktop
- Share reports with stakeholders
- Manage access and permissions
- Schedule data refreshes (automation)
- Organize content in workspaces
- Create dashboards from report visuals
Power BI Service is where most stakeholders view reports, especially people who don’t build dashboards themselves. Sharing usually requires a license, depending on your setup.
Power BI Desktop vs Power BI Service: the key difference
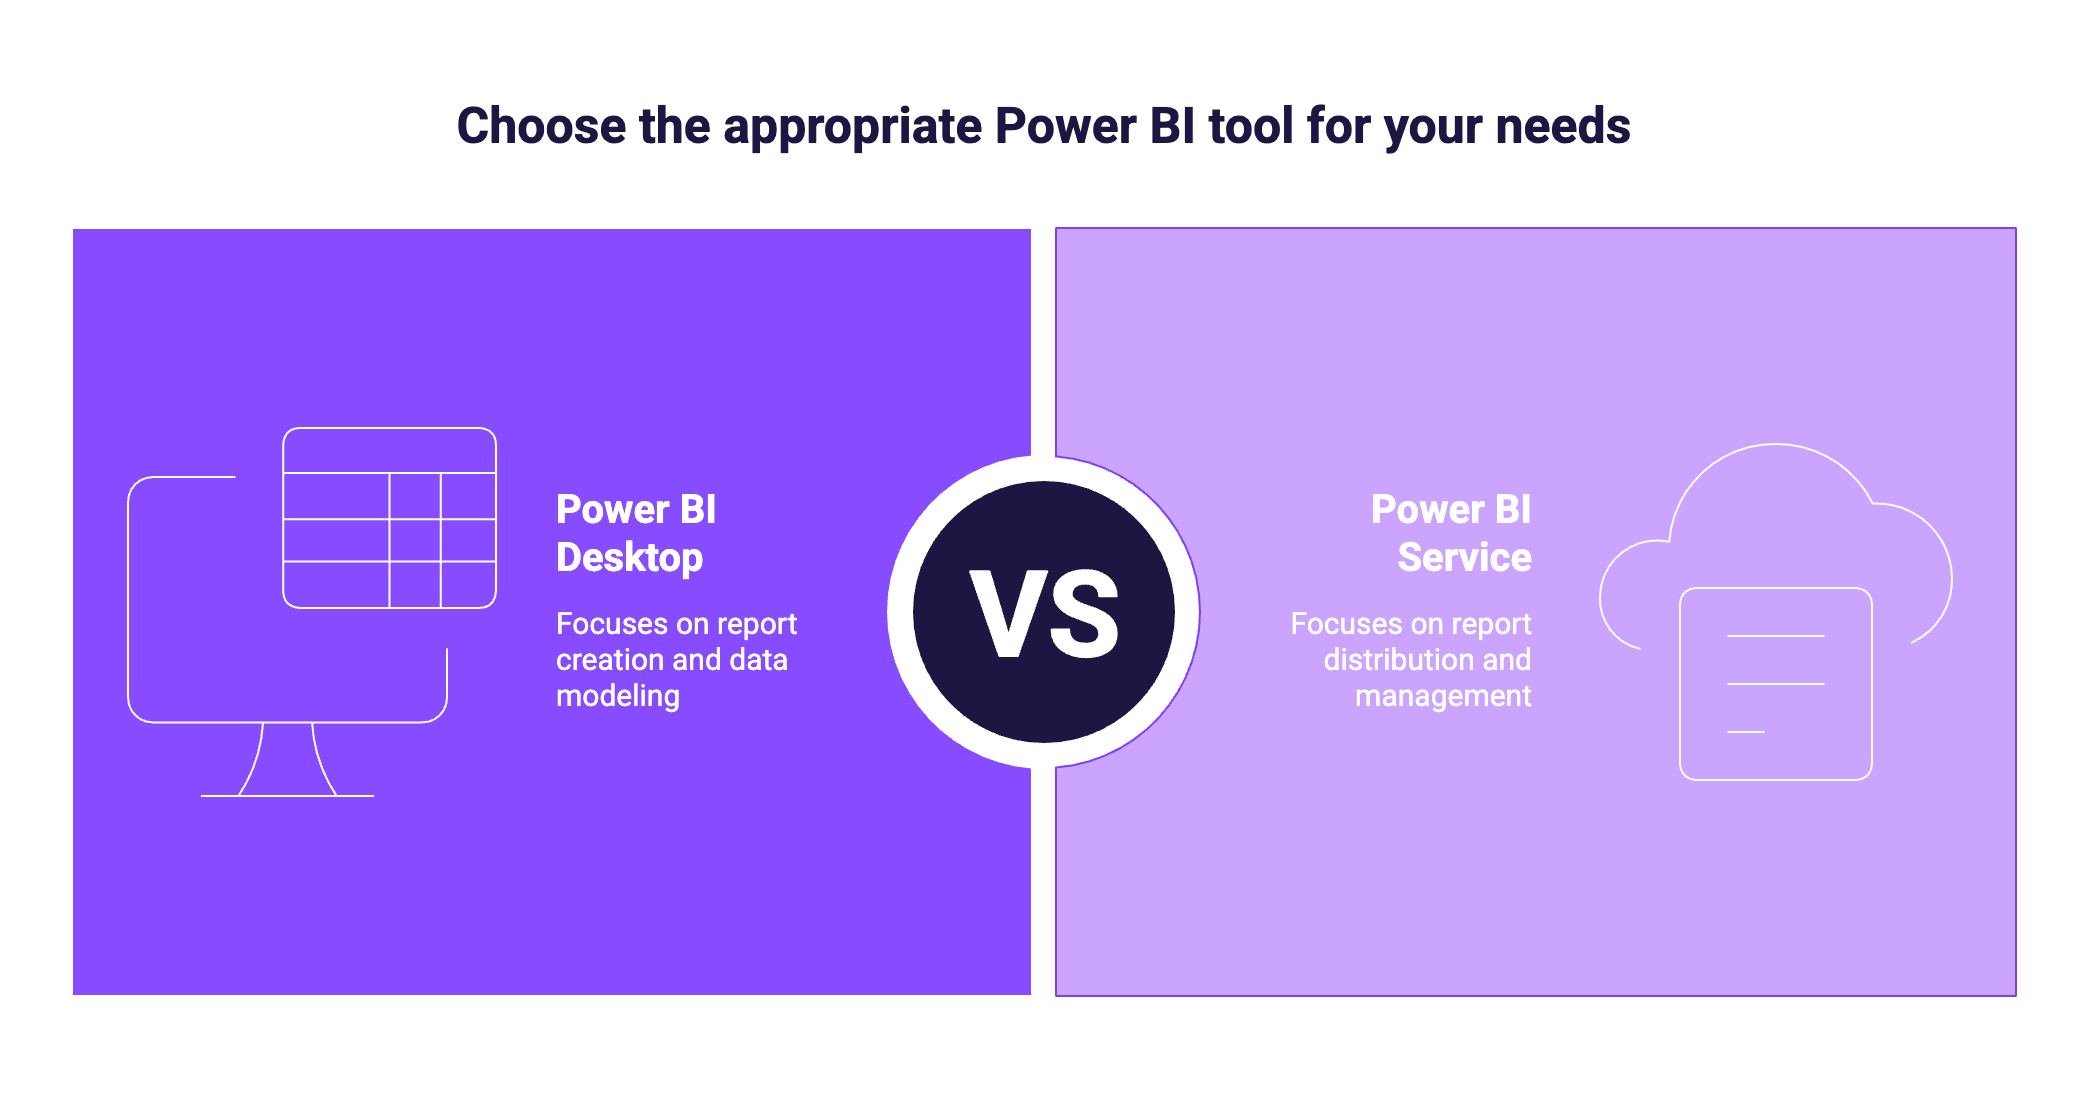
The most useful way to think about it is this:
- Desktop is the creation environment
- Service is the distribution and management environment
Desktop is focused on building the report and the data model. Service is focused on making that report available to others, keeping it updated, and controlling how it’s accessed.
When should marketing teams use each one?
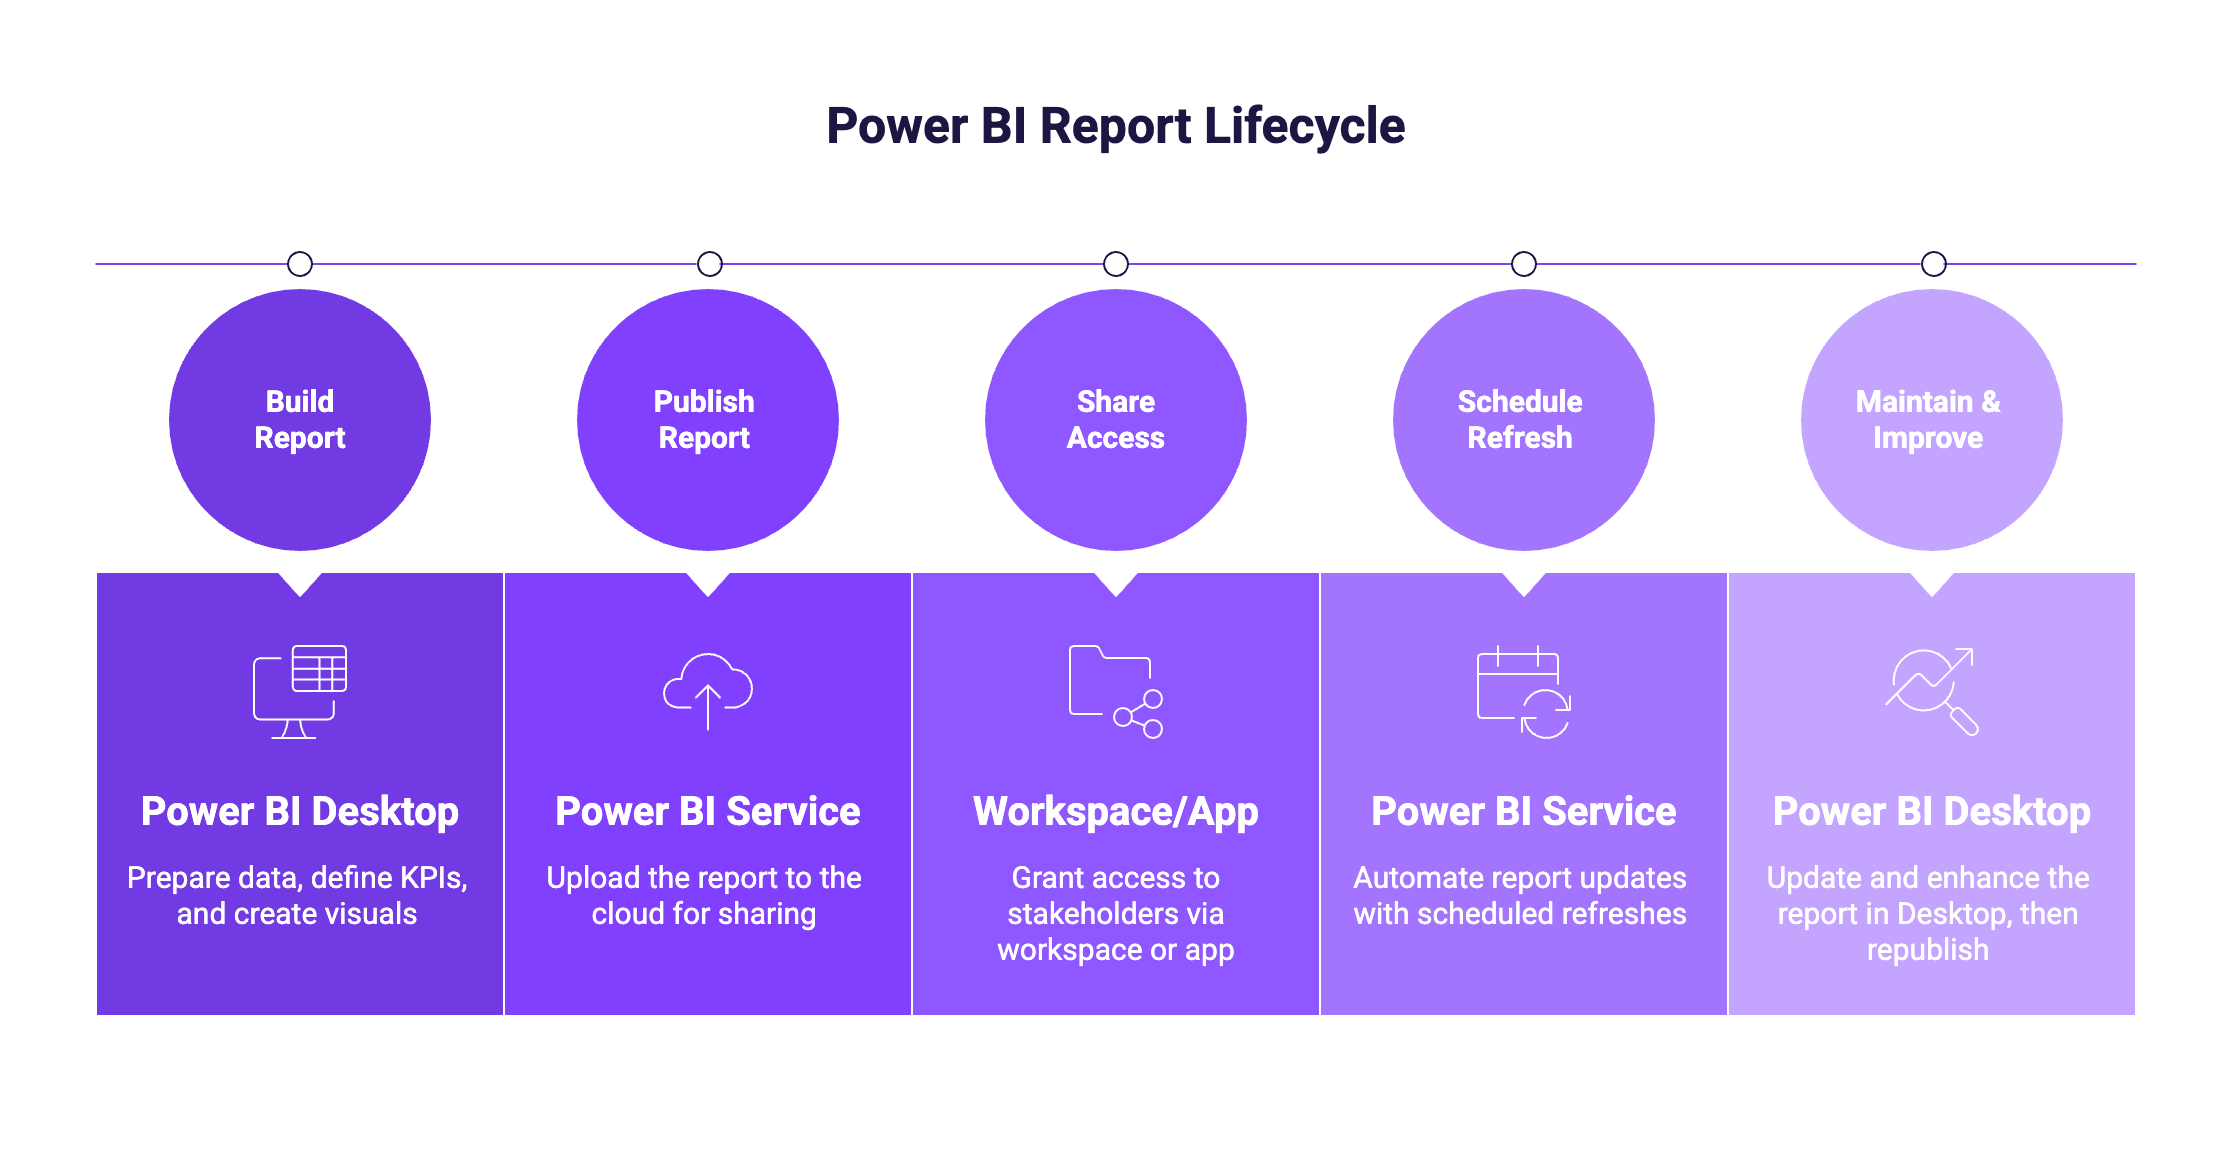
In practice, Desktop and Service are not competing products. They are two parts of a single workflow.
Reports, datasets, and dashboards: what lives where?
These terms are often confusing at first, but they become simple once you know what each one means.
- A dataset is the foundation: it contains the data model, relationships, and KPIs.
- A report is what you build on top of a dataset: a set of interactive pages with visuals.
- A dashboard is a curated view in Power BI Service: it pins key visuals (tiles) from one or more reports.
Where they live:
- In Power BI Desktop, you create the dataset and the report inside a PBIX file.
- In Power BI Service, you can manage datasets and reports after publishing, and you can create dashboards.
So, what should you use?
In most marketing teams, reports are built in Power BI Desktop, then published to Power BI Service to share dashboards, manage access, and automate refresh. If you’re just starting out, begin with Desktop since it’s free and perfect for learning the fundamentals, then switch to the Service as soon as you need collaboration, sharing, or automated updates. In practice, teams rarely choose one over the other, they typically use both.
.svg)