
Your client report needs yesterday’s campaign spend. Before you can explain the results, you open Google Ads, export a file, check the dates, and paste the numbers into the same spreadsheet you updated last week. Add another account or channel, and that preparation repeats.
A marketing data pipeline makes that collection repeatable. You choose the accounts, fields, destination, and schedule once, then check that the data arrives as expected.
This guide explains how the pieces fit together, when a managed connector makes sense, and how to configure a Google Ads-to-BigQuery export with Catchr MCP. The walkthrough includes a video and a checklist for validating the first load. Start with one account and one reporting question; expand after you trust the result.
What is a marketing data pipeline?
A marketing data pipeline is a repeatable workflow that collects data from marketing platforms and delivers it to a reporting tool or storage destination. It can also organize and transform that data for analysis. For example, a scheduled pipeline can load daily Google Ads campaign metrics into BigQuery for recurring client reporting.
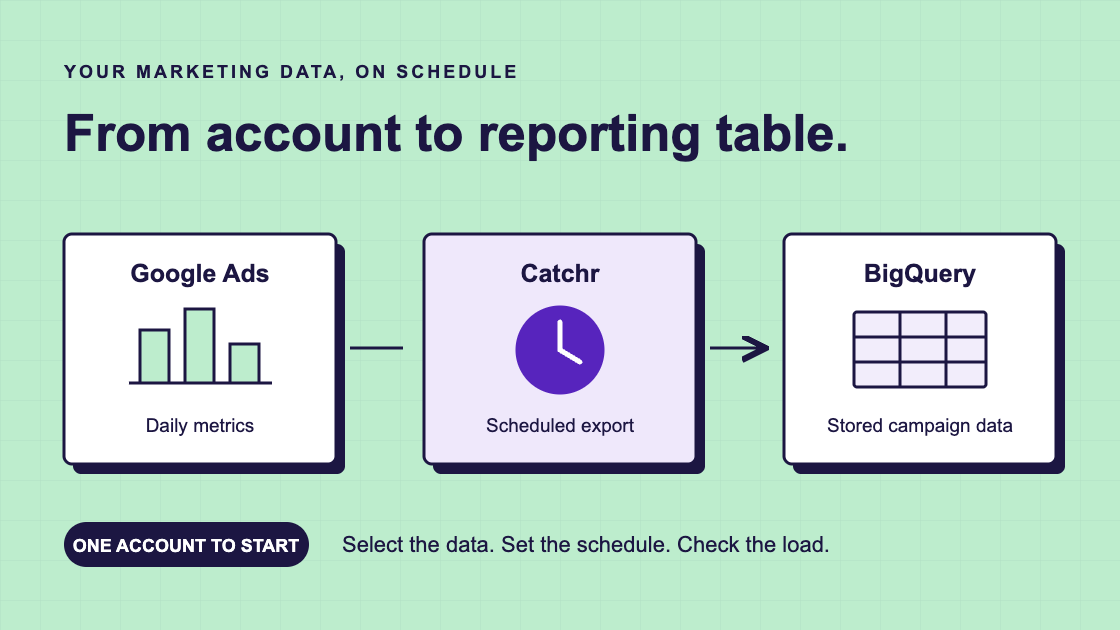
Think of the pipeline as the route your data takes. Google Ads is the source. A connector retrieves selected metrics. BigQuery stores the exported rows. A reporting tool then reads those rows, possibly after someone has prepared a reporting table.
Each part has a different job:
- The pipeline moves and prepares data. Its settings determine what gets collected and when.
- The warehouse stores data. It gives you a place to keep history and work with tables.
- The dashboard displays results. It turns those tables into charts and metrics people use.
You can also send data directly to a reporting tool without a separate warehouse. The appropriate route depends on whether you need a simple report, a retained history, or reusable data for several reports.
The phrase “marketing pipeline” can also describe prospects moving toward a sale. This article covers the flow of marketing data, from platform to report.
How does a marketing data pipeline work?
A useful way to understand the workflow is to follow one day of campaign performance through five steps.
- Select the source. Choose the platform and account: for example, one client’s Google Ads account.
- Collect the data. Retrieve daily campaign identifiers, impressions, clicks, and spend. This step is often called data ingestion.
- Deliver it to a destination. Write the selected data to a table or make it available to your reporting tool.
- Prepare it for analysis. Apply the definitions, calculations, and joins your report needs. This may happen before or after storage.
- Use and monitor it. Refresh the report, verify data freshness, and investigate failed or incomplete loads.
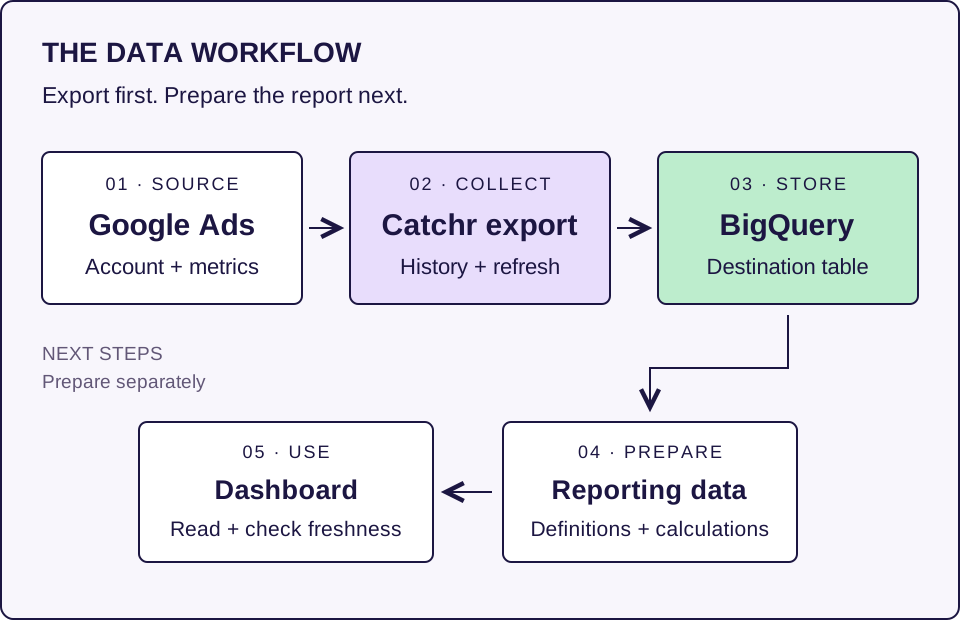
Exporting data does not automatically settle every reporting decision. Someone still needs to decide what counts as a lead, how campaigns map to clients, and which revenue field belongs in a report. Google’s own marketing ELT tutorial separates data loading from the transformations used to prepare it.
ETL vs. ELT
ETL means extract, transform, load: retrieve data, prepare it, then send it to the destination. ELT means extract, load, transform: store the retrieved data first, then prepare it there.
Both can support marketing reporting. If you export platform metrics to BigQuery and later build reporting tables in the warehouse, you are following an ELT pattern. The connector and the reporting model have separate responsibilities.
Scheduled updates vs. real-time data
A scheduled export runs at chosen intervals, such as once each morning. A real-time workflow aims to deliver changes with much less delay. This is a separate choice from ETL versus ELT.
For a daily client report, work backward from the review time. If the team reads it at 9 a.m., allow time for the export, any preparation, and the dashboard refresh. An export starting at 9 a.m. cannot guarantee a complete report at 9 a.m.
What should you decide before building a pipeline?
Write down the report you need before selecting fields. “Track daily spend and traffic by campaign for this client” gives you a clearer starting point than “bring in all the marketing data.”
Use this planning sheet for the first source:
| Decision | What to specify |
|---|---|
| Reporting question | Daily campaign spend and traffic for one client |
| Account | The exact Google Ads account and who can access it |
| Row detail | One row per day and campaign, unless you need additional dimensions |
| Fields | Date, campaign identifiers, impressions, clicks, and spend; confirm available field names |
| Destination | The BigQuery project, dataset, and target table |
| History | The earliest reporting date you need |
| Refresh | Run time, time zone, and how many recent days to reload |
| Validation owner | The person who compares totals and investigates failures |
The detail represented by one row is called its grain. Adding device, country, or ad group changes that grain and usually creates more rows. Only request those breakdowns when a report needs them.
Next, decide where the data should go. A direct connection can be enough for a straightforward dashboard. A warehouse becomes useful when you need to retain history, combine sources using shared rules, or supply the same prepared data to several reports. Our guide to when you need a marketing data warehouse covers that decision in more detail.
Keep the first version small. One account, a few metrics, and a clear comparison against the source make errors easier to spot. Once that works, you have a configuration you can adapt for the next account.
Build your own pipeline or use a managed connector?
You have several ways to move marketing data. Compare them against the accounts, destinations, and reporting rules you actually need.
| Approach | Good fit | Setup and ongoing responsibility |
|---|---|---|
| Manual export | A one-off analysis or checking a small sample | You download, format, and repeat the export yourself. |
| Native transfer | A supported source and destination with suitable fields | You configure access and schedules, then monitor the transfer and prepare reporting data. |
| Managed marketing connector | Recurring exports across supported marketing platforms | The provider maintains supported connectors; you own account access, configuration, checks, and reporting definitions. |
| Custom pipeline | Requirements that available integrations cannot meet | Your team builds and maintains API access, extraction, error handling, scheduling, and storage logic. |
For Google Ads and BigQuery, a native Google Ads transfer is available. Check its supported reports and configuration before deciding whether you need a separate connector. Catchr is another option, particularly when you want to manage exports from supported marketing sources in one place.
Ask three practical questions: Does the approach expose the fields you need? Can it deliver the historical period and refresh behavior your report requires? Who fixes the workflow when access expires or an export fails?
Budget for the connector or integration service, destination storage and queries, and the time spent maintaining reporting models. Building it yourself moves more of that work onto your team.
An AI assistant can help configure a supported integration. The scheduled export still runs through the underlying service. In the example below, Catchr runs the configured job; the chat helps you describe and confirm it.
Build a Google Ads-to-BigQuery pipeline with Catchr MCP
The video below shows a daily campaign export configured through ChatGPT and Catchr MCP. MCP connects the assistant to Catchr’s available tools, so it can help prepare the source, destination, and job settings you request.
Catchr’s 6:56 walkthrough shows configuration and the historical import running. It does not show a completed import or a finished dashboard.
Useful chapters: data request at 0:27, destination setup at 0:48, import settings at 2:51, and job review at 5:09.
1. Prepare your source and destination
The demonstration starts with Catchr MCP already installed and Google Ads already connected. If you are starting from scratch, first connect your AI assistant to Catchr and authorize the Google Ads account you want to report on.
Have the BigQuery project and dataset details ready, along with the credentials and permissions required for the destination connection. If BigQuery is new to you, read what BigQuery does before creating a reporting workflow around it.
2. Describe the data you need
Give the assistant the source, account, daily campaign detail, metrics, and historical period. Ask it to confirm the configuration before creating the job.
Here is an adapted prompt you can fill in:
Help me configure a daily Google Ads export to BigQuery using Catchr. Use [account] and daily campaign-level data with date, campaign identifiers, impressions, clicks, and spend. Import data from [start date] to [end date], then refresh the most recent [number] days on a daily schedule. Ask me to confirm the destination, table, available fields, time zone, and import settings before creating the job. Direct me to Catchr for any required credential entry.
Replace the brackets with your requirements. Confirm the available field names when the assistant presents them; the wording in a prompt is not a guarantee of the exported schema.
3. Configure the destination in Catchr
In the demonstration, the assistant prepares a destination connection using a name, Google Cloud project ID, and BigQuery dataset ID. It then provides a link to a Catchr form.
Open that form and enter the required JSON service account key in Catchr. Keep the key out of the chat. Review the project and dataset before saving the connection, especially if you manage several client environments.
Return to the assistant and confirm the destination. You can then review the selected Google Ads account and the target table. Use a table name that your team can recognize later, rather than relying on the chat history to explain what it contains.
4. Confirm history, refresh, and time zone
The initial historical import and the recurring refresh have different jobs. The historical import loads the past period you selected. Subsequent runs reload a recent window so that updated source values can be collected.
In the video, the historical range runs from January 1 through October 6, 2026, with a daily refresh of the latest seven days. Those are demonstration settings. Choose your own range and refresh window according to the metrics and history you need.
The walkthrough also discusses splitting a large historical import into smaller date ranges if the volume causes timeouts. Start with an amount of data you can inspect, then expand when you have verified the load.
For the schedule, confirm both the displayed time zone and the saved execution time. The demonstration uses 8 a.m. in UTC+2, equivalent to 6 a.m. UTC. For a US team, confirm the supported time zone and how daylight saving changes affect the desired local run time.
When choosing a date field for partitioning, remember that this organizes the table by time. It does not make a date unique: multiple campaigns can legitimately have rows for the same day.
5. Review the datastream and job
The video finishes by opening the created datastream and its job in Catchr. In this workflow, the datastream describes the selected data; the job controls its export to the destination.
Check the account, fields, destination table, historical range, recent refresh window, and schedule against your original request. Then inspect the execution state.
At 5:09, the first historical import is running. Configuration created, import running, and import completed are separate milestones. Wait for completion and validate the destination before treating the table as ready for client reporting. The next section gives you a practical way to do that.
How to check that your marketing data pipeline works
A successful job status is the first check. You also need to establish that the right rows arrived and that the next scheduled run updates them.
- Check the execution. Confirm that the relevant job completed and investigate any reported failure.
- Open the intended destination. Verify the project, dataset, table, and source account.
- Inspect the date range. Compare the earliest and latest dates with the requested import period. Investigate missing dates where the source has reportable activity.
- Check the row detail. Confirm whether rows are daily by campaign or include additional breakdowns.
- Compare source totals. Use the same account, dates, currency, time zone, and filters in Google Ads and the exported data.
- Check the next scheduled run. Confirm that recent dates are updated and that rerunning a period does not inflate totals.
For example, imagine these two rows in an illustrative campaign table. These are invented values for the check, not data from the video or a client.
| Date | Account | Campaign | Clicks | Spend (USD) |
|---|---|---|---|---|
| Nov 2, 2026 | Account A | Brand | 600 | 180.00 |
| Nov 2, 2026 | Account A | Nonbrand | 360 | 540.00 |
| Daily total | 960 | 720.00 |
Both campaign rows share a date. Removing “duplicate dates” would delete legitimate data. Check uniqueness at the full expected grain: here, date plus account ID plus campaign ID. Add other dimensions to that check if your export includes them. Names are shown in the example for readability; stable identifiers are safer for matching records.
The source comparison should return 960 clicks and $720 in spend for the same scope. If it does not, investigate filters, incomplete loads, duplicate rows, currency, and reporting time zones before adjusting the dashboard to hide the mismatch.
Recent platform values can change after their first collection. Choose the reload window to fit the metrics you use, particularly when conversions can arrive or be revised later. The video’s seven-day window is an example, not a universal rule for conversion reporting.
Finally, record who checks failures and where to find the job. An agency should be able to hand the account to another team member without making them reconstruct the setup from a conversation.
Common marketing data pipeline mistakes
Requesting every available breakdown. Device, country, campaign, and ad group can multiply the number of rows. If the report only needs campaign totals, start there. Add detail when you can name the question it will answer.
Treating matching field names as matching definitions. Two platforms may both expose “conversions” while counting different actions with different attribution settings. Document which actions each metric includes before placing them in a shared column.
Adding attributed conversions as unique customers. If two ad platforms each claim the same purchase, adding their counts does not create a deduplicated customer total. Use an appropriate order or CRM identifier and a defined matching method when you need that view. Moving the data into one warehouse does not resolve attribution by itself.
Expecting live numbers from a daily export. A report queried at noon may still reflect the morning load. Display a meaningful data freshness indicator and schedule downstream reporting after the export has had time to finish. More frequent dashboard refreshes cannot retrieve data that has not reached the destination yet.
Start with one account you can verify
Choose one client account and a report you already understand. Configure the export, compare a small date range with Google Ads, and check the next scheduled run. Then extend the workflow to more accounts or sources with the same checks in place.
Connect Google Ads to BigQuery to start with the workflow shown here, or explore how to send marketing data to BigQuery from other supported sources.