Blog post
Catchr
Power BI
LinkedIn Page

Through this thorough guide, you’ll learn how to seamlessly bring your LinkedIn Pages data into the robust visualization environment of PowerBI. By the end of this tutorial, you'll be fully equipped to transform your marketing metrics into insightful dashboards that will inform your strategy and decision-making process.
Begin by navigating to the Catchr homepage. From there, look for the Source option within the left-side menu. Click this, and then choose Add a Source from the upper right section. Now, select 'LinkedIn Pages' as your platform of choice and proceed through the authentication steps to establish a connection between Catchr and LinkedIn Pages.


PowerBI Desktop:
In PowerBI Desktop, you access data from a multitude of resources. Here, we'll be importing using a web data source.


Let PowerBI work its magic; once your data is imported, utilize the PowerBI Query Editor to refine your data types. Now you can embark on creating a compelling dashboard, laden with insights, ready to be published and shared with your team.
PowerBI Web App: After importing data to PowerBI Desktop, publish it to move your data online. Within the PowerBI web app, navigate to New Report and select from your published datasets to utilize them in crafting new reports.
In this tutorial, we've outlined the ways to enhance your marketing analysis by integrating LinkedIn Pages data into PowerBI. Applying these steps will allow you to capitalize on the detailed metrics provided by LinkedIn and the powerful data manipulation and visualization capabilities of PowerBI.
Exploring the comprehensive set of metrics available for LinkedIn Pages can propel your data visualization to new heights with PowerBI. Metrics such as follower demographics (including industry and region), engagement rates (like clicks and likes), and detailed content analytics (including post impressions and engagement) are just the tip of the iceberg.
You might, for example, create a customized report tracking your LinkedIn Pages' follower growth over time, dissected by industry, which can inform you about your most engaged sectors. Or maybe, you'd prefer a dashboard that showcases the performance of different post types, allowing you to fine-tune your content strategy based on real data-driven insights.
The power at your fingertips with PowerBI’s expansive visualization tools, married with the precise data extracted from your LinkedIn Pages, means you have all you need to maximize the impact of your social media efforts. Dive into the rich analytics and curate dashboards that not only tell a compelling story but also drive impactful business decisions.
Learn more about the diverse metrics for LinkedIn Pages that you can utilize within PowerBI by visiting Catchr's LinkedIn Pages Metrics Listing.

Start using Power BI with a ready-to-use template
Get the template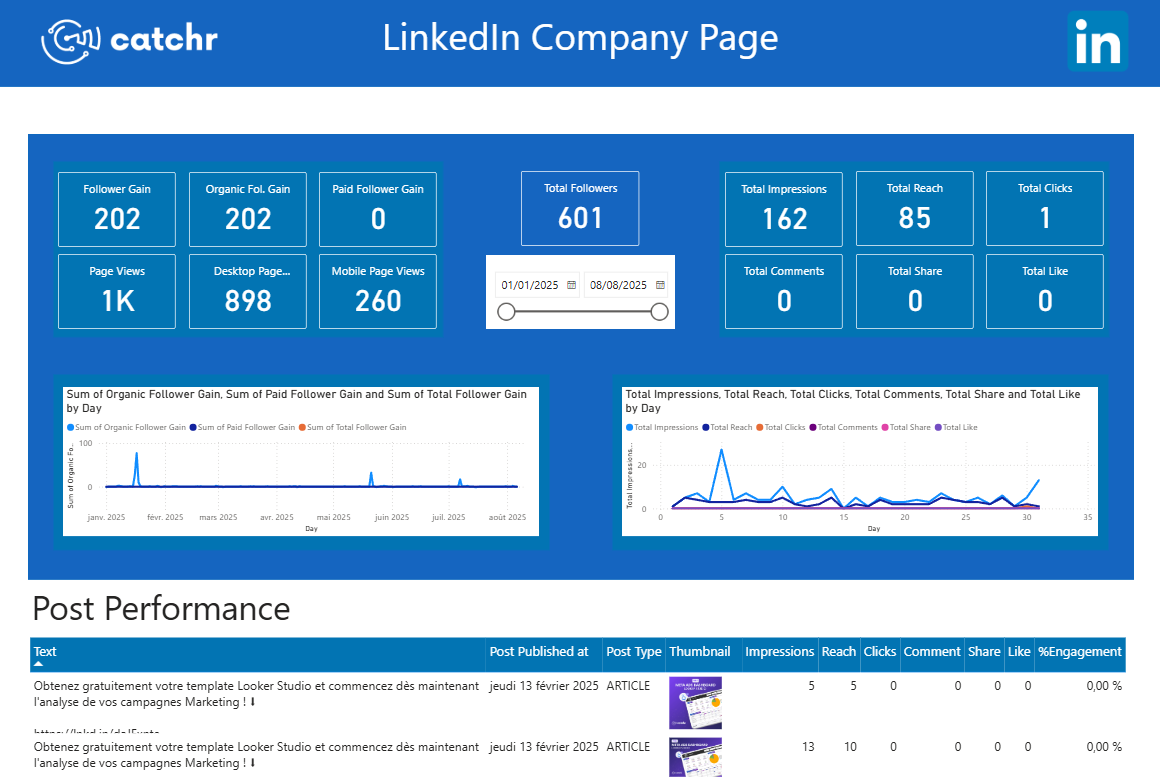
Start analyzing your data with a Power BI template
Catchr provides free dashboard templates to help you start analyzing your data on Power BI — 20+ available templates!
See all the Power BI templates


