







Starter
For freelancers and small teams.
$ 24 /mo
Billed monthly · cancel anytime
Platforms3
Accounts10


Trusted by teams that would rather improve campaigns than copy cells.










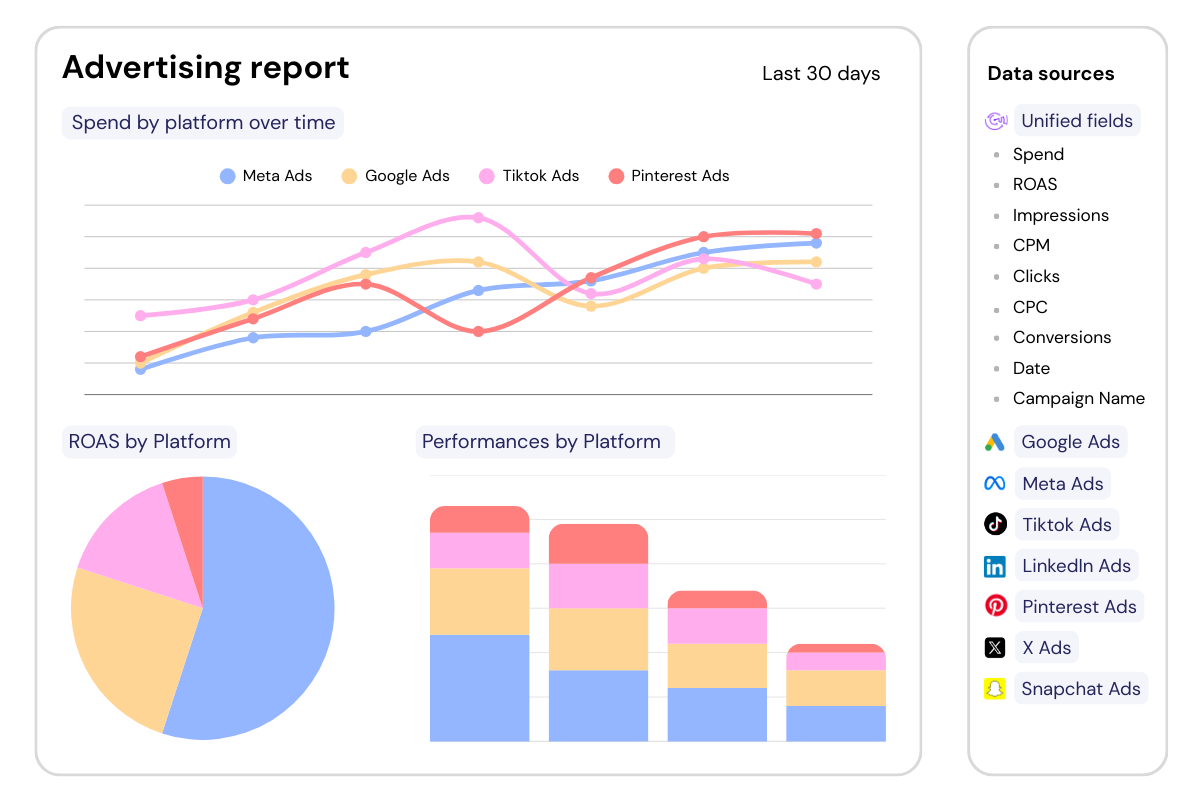
Add Catchr to Google Sheets from the Google Workspace Marketplace, then open it from the spreadsheet where you want to work.


Open Google Sheets and start the Catchr add-on. Sign in with your Catchr account.
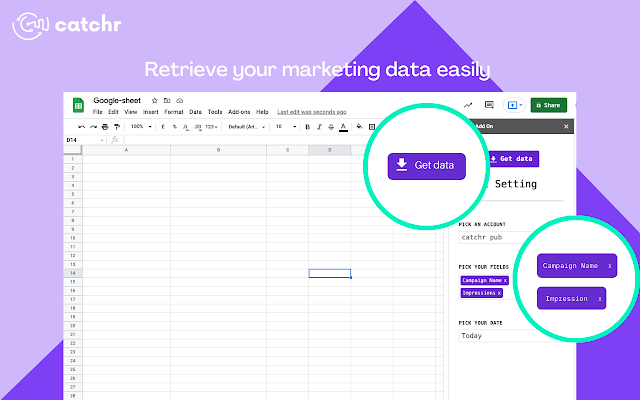

Run your first import, then schedule automatic refreshes to keep your spreadsheet up to date while your formulas, charts, and pivot tables continue working.
Available metrics
Available dimensions


What our customers say about us.
After three years of use, Catchr has become essential for both our teams and our clients. So far, it has been our best solution for compiling and analyzing data from different advertising platforms. It’s easy to set up, and the customer service is responsive and excellent.

With Catchr’s automated API, we can finally collect and centralize all advertising data, connect it with booking information, and calculate the real ROAS for our restaurant clients. It gives them full visibility, more autonomy, and the ability to optimize campaigns to maximize ROI.

The solution is a real game changer, providing optimal time savings for our data reporting. The major strength of the solution is their highly responsive and professional support.

Install or open the Catchr add-on in Google Sheets, connect Pipedrive, and choose the source account(s) you need. Use Get Data to import Person Active Flat and Person Activities Count into a dedicated raw-data tab.
Select Person Active Flat, Person Activities Count, and Person Closed Deals Count with the relevant contact dimensions available from Pipedrive. Set the account(s), date range, and filters before importing a focused result into Google Sheets.
Schedule the Pipedrive query to refresh hourly, daily, weekly, or monthly. Keep Person Active Flat and Person Activities Count current on the cadence that fits a report tracking pipeline value, created deals, won deals, and win rate by owner.
Keep imported Pipedrive rows for Person Active Flat and Person Activities Count in a dedicated data tab, with formulas, charts, and pivot tables in report tabs. Refreshes update the query output while Google Sheets retains its sharing controls.
Build a Pipedrive report that summarizes pipeline value, created deals, won deals, and win rate by owner. Compare Person Active Flat with Person Activities Count in Google Sheets to guide pipeline prioritization and sales coaching.
Our team is always here to answer any questions you may have about our data connector.
Connect your marketing platforms and build a data workflow your entire agency can use.