Home > Destinations > Google Sheets > Impact.com

Connect Impact.com to Google Sheets

Import Impact.com data into Google Sheets with Catchr. Build custom reports, schedule refreshes, and replace manual CSV exports without code.

Looker Studio
Power BI
Google Sheets
BigQuery
Snowflake

Trusted by teams that would rather improve campaigns than copy cells.

What a Impact.com export cannot do, and a connected sheet can

Manager exports one account, one date range, one set of columns. Catchr keeps the same query running, so the sheet you built last month still fills itself this month.

The Monday-morning scramble, deleted

No more opening every account, changing every date range, downloading every CSV, and rebuilding the same report before the weekly meeting.

One campaign. One shared language.

Organize each source in its own clean tab, then bring spend, traffic, leads, and revenue together in the views your team actually uses.

A file your team can actually work in

Add forecasts, targets, comments, formulas, client notes, and custom calculations around your campaign data.

How to connect Impact.com to Google Sheets

No scripts to maintain. No API documentation to study. No recurring CSV ritual.

Step one

Install the Google Sheets add-on

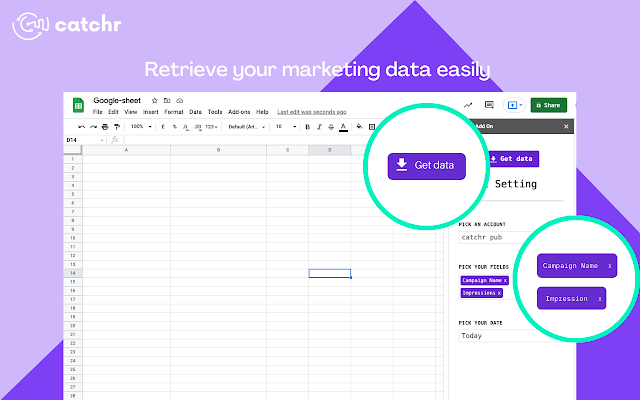
Add Catchr to Google Sheets from the Google Workspace Marketplace, then open it from the spreadsheet where you want to work.

Step Two

Launch the Catchr add-on

Open Google Sheets and start the Catchr add-on. Sign in with your Catchr account.

Step Three

Configure your import

Choose Impact.com, the accounts, the metrics and dimensions, the date range, and the cell where the data should land.

Step Four

Refresh automatically

Run your first import, then schedule automatic refreshes to keep your spreadsheet up to date while your formulas, charts, and pivot tables continue working.

Impact.com metrics and dimensions available in Google Sheets

Access 0 metrics and 165 dimensions from Impact.com connectors including Program Name, Program State, Partner State, Ad Program Name, Ad Type, Landing Page, Deal Name, Deal Start Date, Deal End Date, .

0

Available metrics

165

Available dimensions

Five tabs that replace five recurring Impact.com headaches

Use Catchr to create dashboards that show what is working, what is wasting budget, and where performance is changing.

What changed since yesterday?

Track .

Use formulas or conditional formatting to highlight sudden spend increases, falling conversion volume, or acquisition costs moving outside your target range.

The media buyer opens one tab and immediately knows where to investigate.

Will we hit the plan?

Compare planned budget with actual spend by client, account, campaign, or market.

Calculate how much of the month has passed, how much of the budget has been consumed, and where the campaign is likely to finish at its current pace.

Spot overdelivery and underspending before the end-of-month explanation.

Where should the next budget move go?

Place Impact.com beside other channel.

Compare the KPIs that can genuinely be shared across platforms, while preserving channel-specific metrics like in their own source tabs.

The result is not a forced attribution model. It is a clearer view of how each channel is contributing.

What can we explain in five minutes?

Create a client-facing tab with performance, budget status, key changes, comments, and next actions.

The raw source tabs remain available for deeper investigation, while the client receives a view that answers the questions they are most likely to ask.

No live tour through all your platforms required.

Switch easily with Program Name, Program State, Partner State, Ad Program Name, Ad Type, Landing Page, Deal Name, Deal Start Date, Deal End Date.

What should we repeat next time?

Keep a structured history of campaign performance, targets, observations, and decisions.

Compare launches, promotions, seasons, creative concepts, or audiences using a reporting structure that remains under your control.

The spreadsheet becomes more than a weekly deliverable. It becomes the memory of your acquisition team.

Impact.com to Google Sheets pricing

Choose your plan by the number of platforms and accounts you report on.

Starter

For freelancers and small teams.

$ 24 /mo

Billed monthly · cancel anytime

Platforms3
Accounts10
Start free trial

Growth

For agencies managing more clients.

$ 239 /mo

Billed monthly · cancel anytime

Platforms10
Accounts100
Start free trial

Scale

For teams reporting at scale.

$ 599 /mo

Billed monthly · cancel anytime

Platforms25
Accounts500
Start free trial

Customer testimonials

What our customers say about us.

85 %
Faster
Reporting time

After three years of use, Catchr has become essential for both our teams and our clients. So far, it has been our best solution for compiling and analyzing data from different advertising platforms. It’s easy to set up, and the customer service is responsive and excellent.

Valentin Keravel
CEO, Laio – Agency

With Catchr’s automated API, we can finally collect and centralize all advertising data, connect it with booking information, and calculate the real ROAS for our restaurant clients. It gives them full visibility, more autonomy, and the ability to optimize campaigns to maximize ROI.

Corentin Largeron
Freelance
30
hours saved

The solution is a real game changer, providing optimal time savings for our data reporting. The major strength of the solution is their highly responsive and professional support.

Corentin Largeron
CEO at The Browz – Agency

Impact.com to Google Sheets: FAQs

Answers to common questions about connecting Impact.com data to Google Sheets.

How do I import Impact.com data into Google Sheets?

Open the Catchr add-on in Google Sheets, connect Impact.com with your Account SID and Auth Token, then use Get Data to import supported company, partner, program, and ad fields into a dedicated data tab.

Which Impact.com fields can I select for a Google Sheets report?

Choose from 165 supported dimensions, including program name, company homepage, example landing page, marketplace category, mobile-ready ad status, trademark bidding permission, account SID, and timezone.

Can I schedule Impact.com data refreshes in Google Sheets?

Yes. You can schedule the Impact.com query to refresh hourly, daily, weekly, or monthly so your selected company, partner, program, and ad fields are updated on a cadence that fits your reporting workflow.

Will refreshing Impact.com data preserve my Google Sheets formulas and pivot tables?

Keep the imported Impact.com data in a dedicated tab and build formulas, charts, and pivot tables in separate report tabs. Refreshes update the query output while Google Sheets retains its sharing controls.

What can agencies report on with Impact.com data in Google Sheets?

Agencies can organize advertiser, partner, program, and ad information in one spreadsheet, compare program categories and landing pages, and review settings such as mobile-ready ads or trademark bidding without manually assembling the data.

Still have a question?

Our team is always here to answer any questions you may have about our data connector.

Your next report should not start with five exports

Connect your marketing platforms and build a data workflow your entire agency can use.

14 days free-trial
No credit-card required
100+ sources