Home > Integrations > Chartmogul

Connect ChartMogul marketing data to your reporting, spreadsheet, warehouse, and AI tools

Connect your ChartMogul data with Catchr to track revenue, subscriptions, and key SaaS metrics in your favorite dashboards and databases.

Looker Studio
Power BI
Google Sheets
BigQuery
Snowflake

Used by the world's leading companies

From Chartmogul data to reports, insights, and answers.

Use Catchr Chartmogul connector to send the data into the tools you already use, from AI assistants to client dashboards, spreadsheets and datawarehouse.

Analyze

Ask AI for answers

Ask AI directly about your marketing performance, using live data connected from all your sources.

Understand what changed, why it happened, and where to focus next.

Dashboard

Build client-ready reports

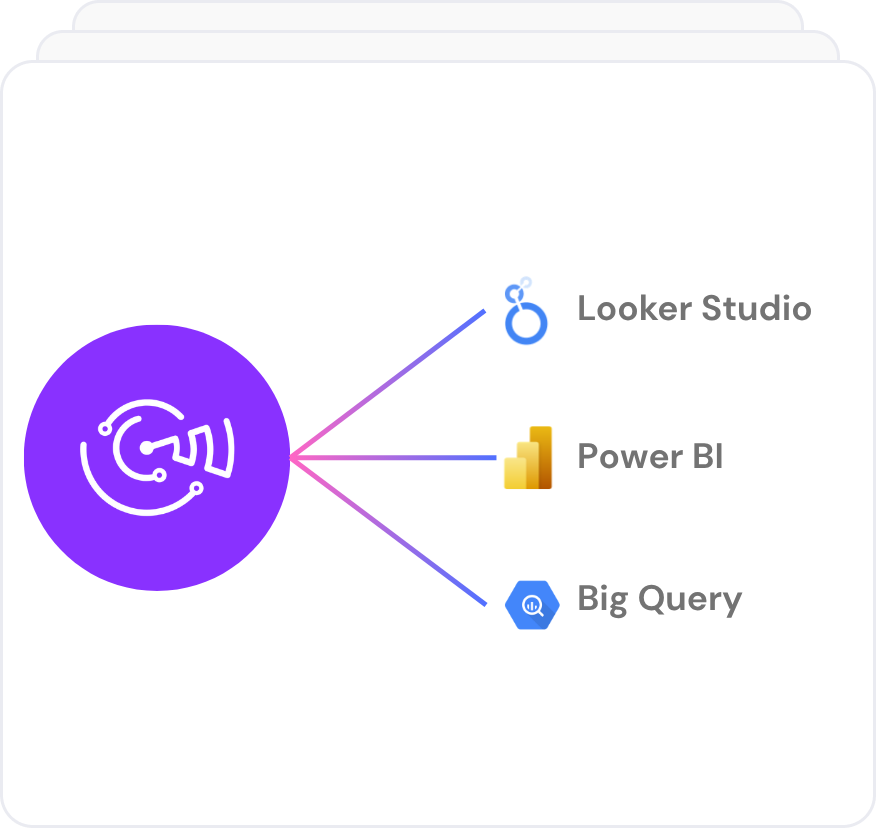
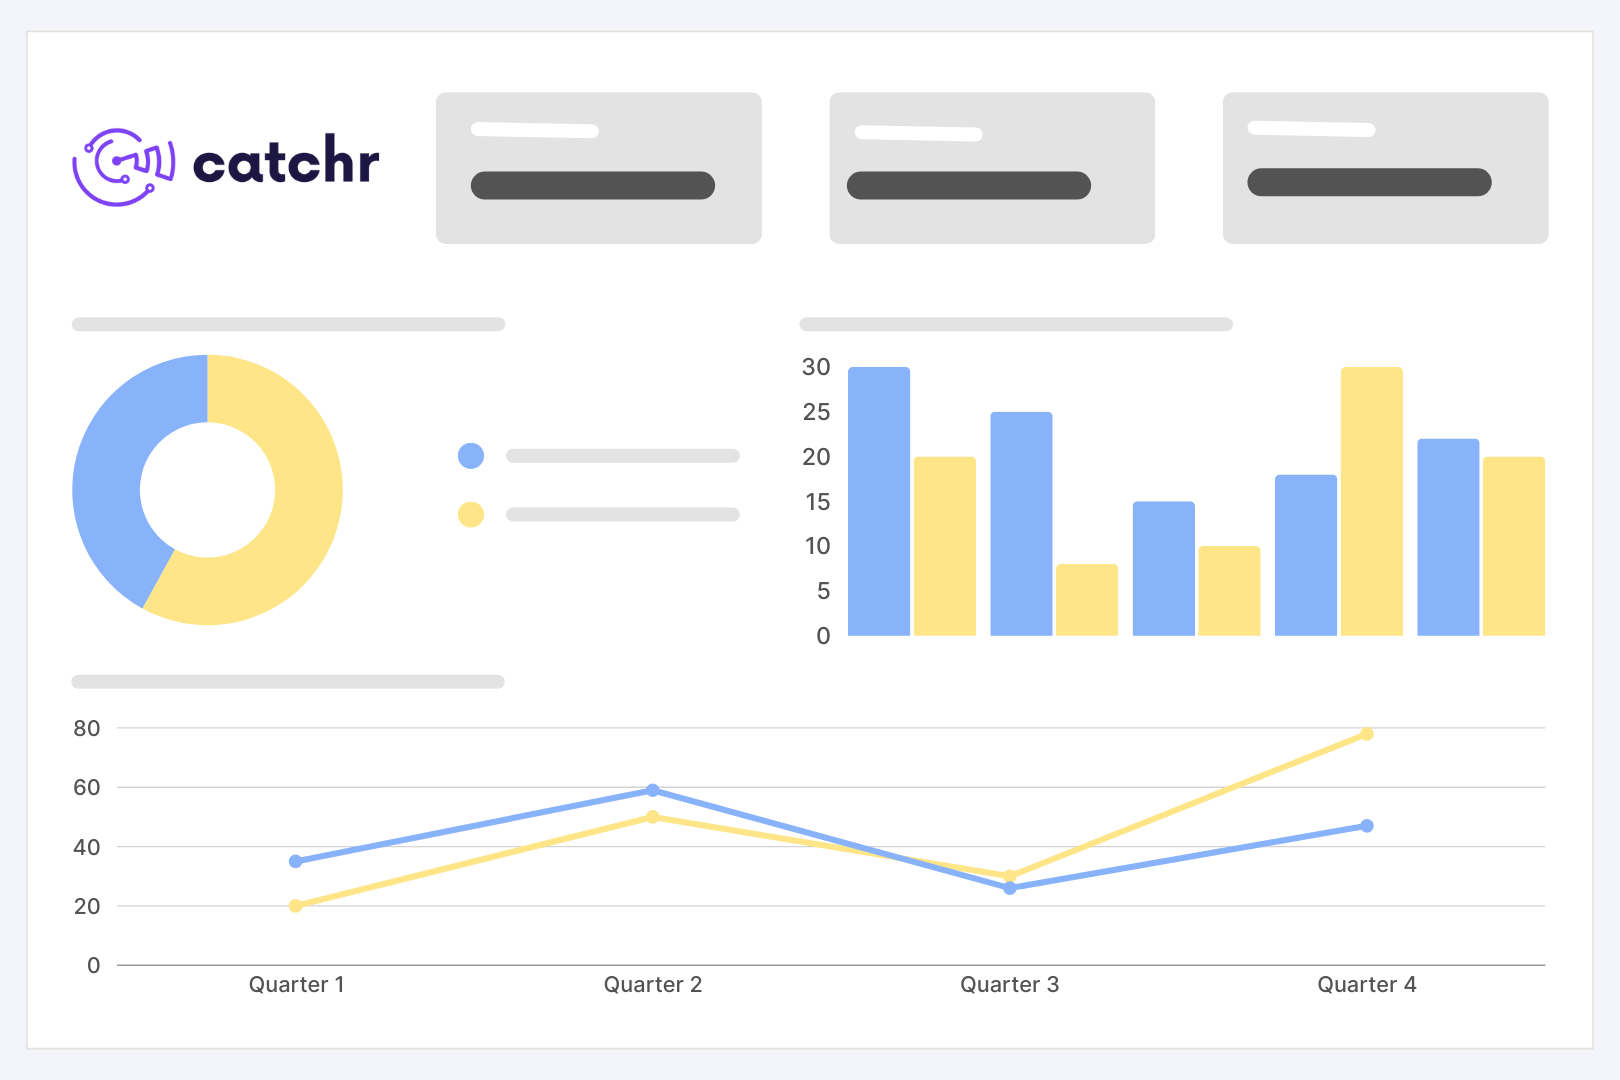
Create always up-to-date dashboards in Looker Studio or Power BI for client reporting, performance reviews, and weekly monitoring.

Spreadhsheet

Keep spreadsheets up to date

Send data to Google Sheets or Excel without CSV exports. Track spend, ROAS, CPA, campaign performance, and client KPIs in clean, refreshable spreadsheets.

Datawarehouse

Export your campaign data

and more...

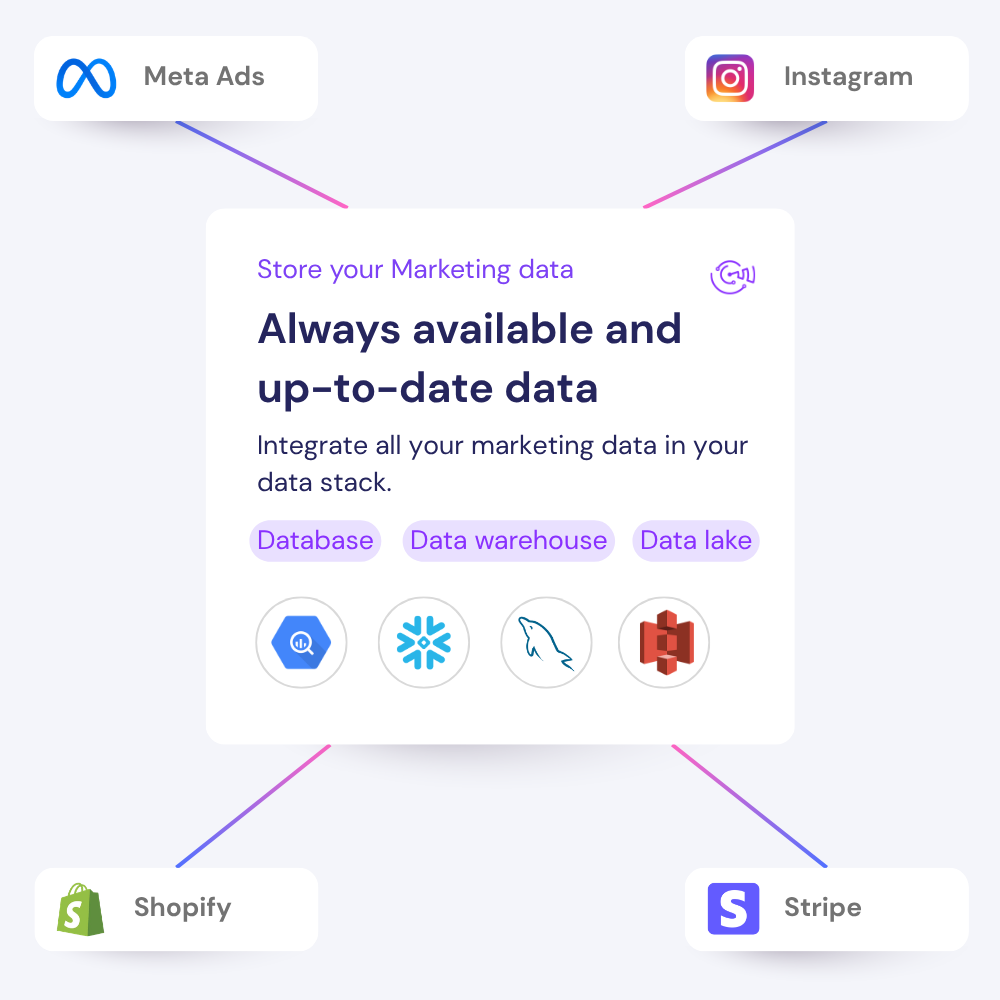
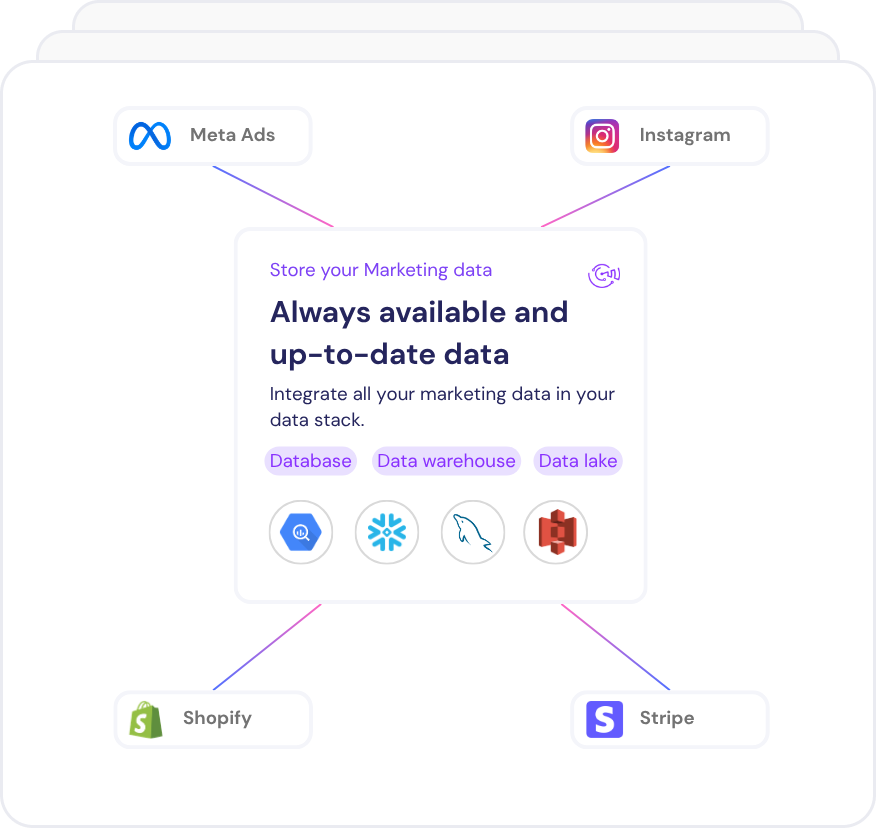
Move your  data into Google BigQuery, Azure SQL, Amazon Redshift or your storage system for deeper analysis, blending, and backup.
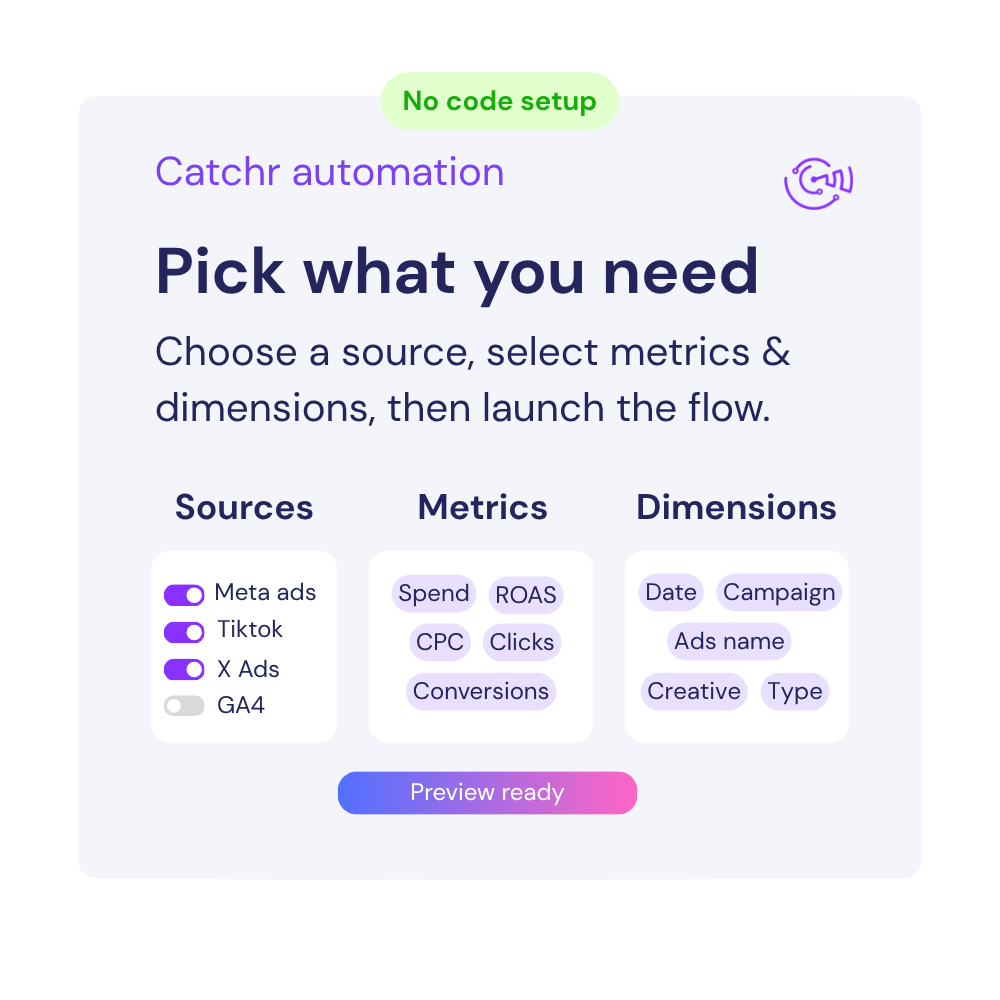
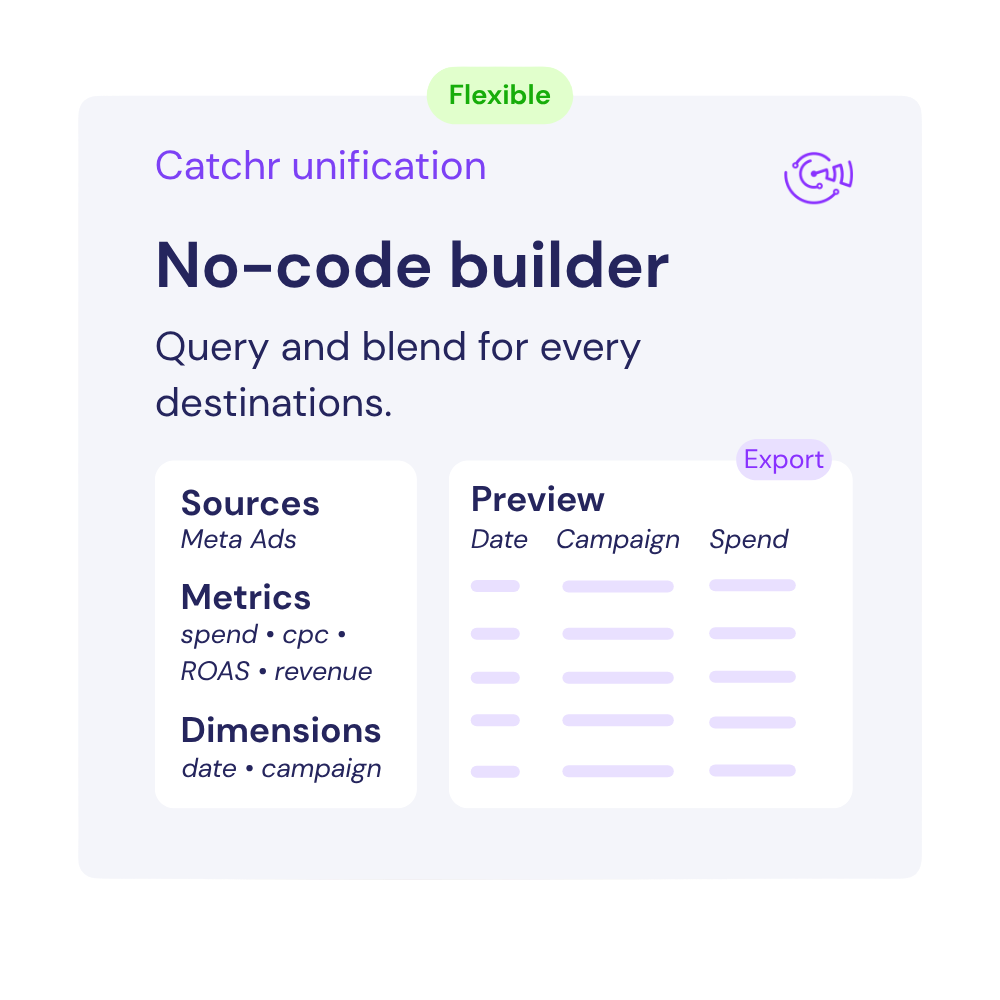
Need more destinations ? 

Why use Catchr Chartmogul connectors for exporting data ?

Catchr helps marketers and agencies move from manual Chartmogul exports to reliable reporting workflows across dashboards, spreadsheets, warehouses, and AI tools.

No manual csv export

Stop downloading files from Chartmogul Manager every time a client report, spreadsheet, or dashboard needs fresh numbers.

Works with every reporting workflow

Send Chartmogul data to Looker Studio, Google Sheets, Power BI, BigQuery, Excel, Claude, ChatGPT, and more.

Built for multi-account reporting

Connect several Chartmogul accounts and keep agency, client, or brand reporting organized from one place.

Chartmogul metrics and dimensions available in Catchr

Access 11 metrics and 40 dimensions from Facebook Ads connectors including Date, Customer Company, Customer Status, Customer Country, Customer Currency, MRR, ARR, ARPA, Customer Churn Rate, MRR Churn Rate, LTV and many more...

11

Metrics availables

40

Dimensions availables

Built for everyday paid media reporting

Turn Chartmogul data into clear reports, spreadsheets, and AI-ready insights your team or clients can use every week.

Find what changed in your Chartmogul performance with the Catchr MCP

Ask questions about Date, Customer Company, Customer Status, Customer Country, Customer Currency using fresh Chartmogul data. Catchr helps you bring your marketing data into AI tools so you can understand performance faster.

Build reports your clients can actually read

Send Chartmogul data to Looker Studio, Power BI, or spreadsheets to create clear client reports with MRR, ARR, ARPA, Customer Churn Rate, MRR Churn Rate, LTV results automatically updated.

Review what drives results across Date, Customer Company, Customer Status, Customer Country, Customer Currency

Compare Date, Customer Company, Customer Status, Customer Country, Customer Currency to see where budget, traffic, or revenue is improving and where performance is dropping.

Compare Chartmogul with your other channels

Combine Chartmogul with your others marketing to understand performance across your full acquisition journey.

Keep an eye on MRR, ARR, ARPA, Customer Churn Rate, MRR Churn Rate, LTV

Track ChartmogulMRR, ARR, ARPA, Customer Churn Rate, MRR Churn Rate, LTV in refreshable dashboards or spreadsheets so you can spot changes before they become reporting problems.

Chartmogul reports and ressources.

Use your Chartmogul data to build the reports your team or clients check most often.

Free marketing dashboard templates

Get 100+ dashboard templates for free, to start analyzing your Marketing data on Data Studio (ex Looker Studio), Power BI, and Google Sheets!

Marketing news & trends

Get insights on marketing analytics, and tools that turn data into growth. Find everything to stay ahead.

Master your analytics skills

Develop your skills with complete and practical Data Studio (ex Looker Studio) & Google Sheets lessons.

How to export Chartmogul data to any destination

Connect your Chartmogul account once, choose the metrics and dimensions you need, and send clean marketing data to dashboards, spreadsheets, warehouses, or AI tools.

Connect your data now

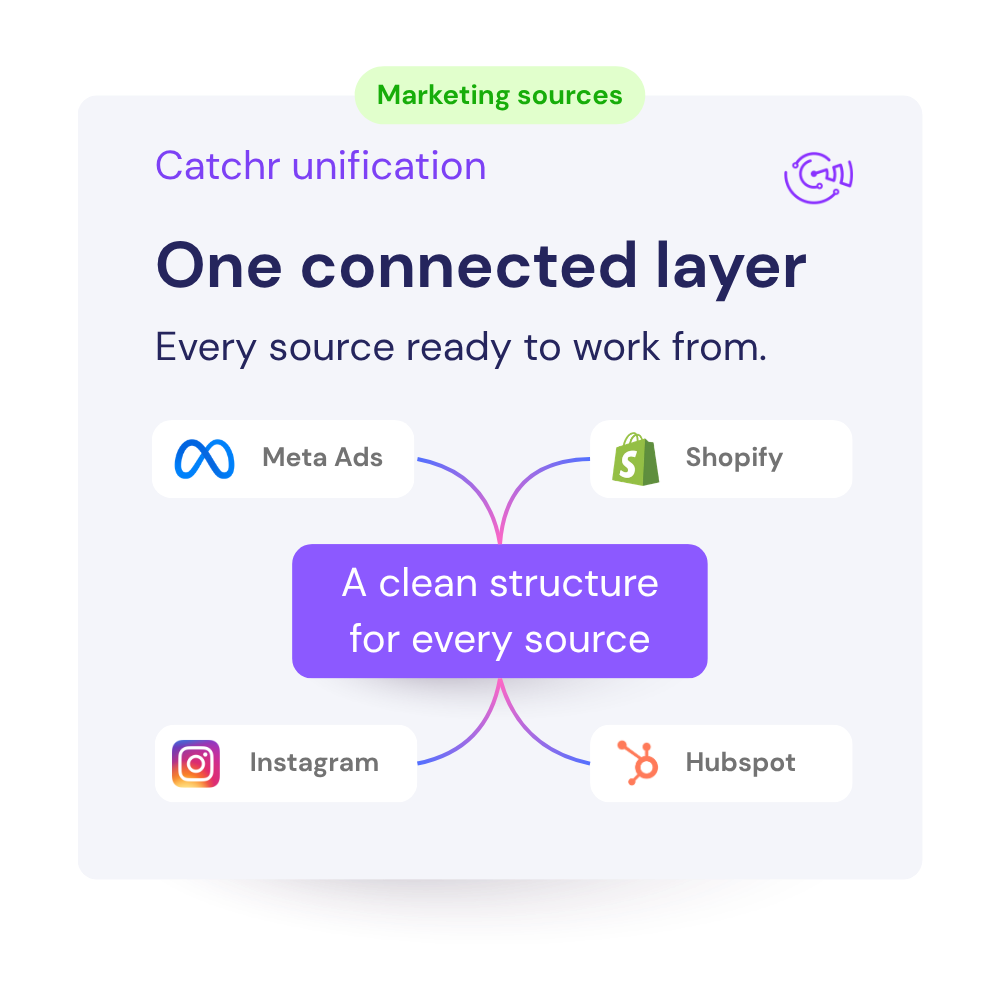
With catchr, it's easy to connect all your marketing data to your favorite reporting, AI or dashboarding tools. 

Customer testimonials

What are customer tell from us.

85 %
Faster
Reporting time

After three years of use, Catchr has become essential for both our teams and our clients. So far, it has been our best solution for compiling and analyzing data from different advertising platforms. It’s easy to set up, and the customer service is responsive and excellent.

Valentin Keravel
CEO, Laio – Agency

With Catchr’s automated API, we can finally collect and centralize all advertising data, connect it with booking information, and calculate the real ROAS for our restaurant clients. It gives them full visibility, more autonomy, and the ability to optimize campaigns to maximize ROI.

Corentin Largeron
Freelance
30
hours saved

The solution is a real game changer, providing optimal time savings for our data reporting. The major strength of the solution is their highly responsive and professional support.

Corentin Largeron
CEO at The Browz – Agency

Chartmogul connector FAQs

Answers to common questions about connecting Chartmogul data to spreadsheets, dashboards, AI assistants, and reporting tools with Catchr.

What is Chartmogul ?

ChartMogul is a subscription analytics platform that helps SaaS and subscription businesses monitor revenue, customers, churn, retention, and growth from their billing and payment data.

What Chartmogul metrics can I export from the connector ?

You can export key metrics from Chartmogul and dimensions such as Date, Customer Company, Customer Status, Customer Country, Customer Currency and MRR, ARR, ARPA, Customer Churn Rate, MRR Churn Rate, LTV.

Can I connect multiple Chartmogul accounts ?

Yes. Catchr supports multiple Chartmogul accounts, which is useful for agencies, freelancers, and teams managing several clients or brands.

Can I combine Chartmogul with other channels?

Yes. You can combine Chartmogul data with sources like Google Ads, TikTok Ads, LinkedIn Ads, Google Analytics, and Search Console to build cross-channel reports.

How often is the data refreshed ?

Catchr keeps your Chartmogul data updated automatically, so your spreadsheets, dashboards, and reports stay current without manual exports.

Still have a question ? 

Our teams is always here to responds to any question you could have about our data connector.