Power Query overview: prepare and clean data in Power BI
Discover what Power Query is in Power BI, how it works, and why it’s essential for cleaning and preparing marketing data before reporting.
When marketers start using Power BI, they often focus on charts and dashboards. But in practice, most reporting issues come from data that isn’t clean, consistent, or well structured. This is exactly where Power Query comes in.
Power Query is the part of Power BI that lets you prepare, clean, and shape data before it’s used in reports. You don’t need a technical background to understand it, but having the right mental model makes everything that follows much easier.
What is Power Query?
Power Query in one sentence
Power Query is the data preparation layer of Power BI. It runs before reporting and defines how raw data is transformed into analysis-ready tables.
You can think of it as the backstage of Power BI: dashboards are what users see, Power Query is where the work happens behind the scenes.
What Power Query does
Power Query is used to:
- clean and standardize data
- filter rows and remove unnecessary columns
- change data types
- combine multiple files or datasets
- reshape exports so they are ready for analysis
What it does not do:
- it does not create visuals
- it does not calculate KPIs like DAX
- it does not modify data at the source
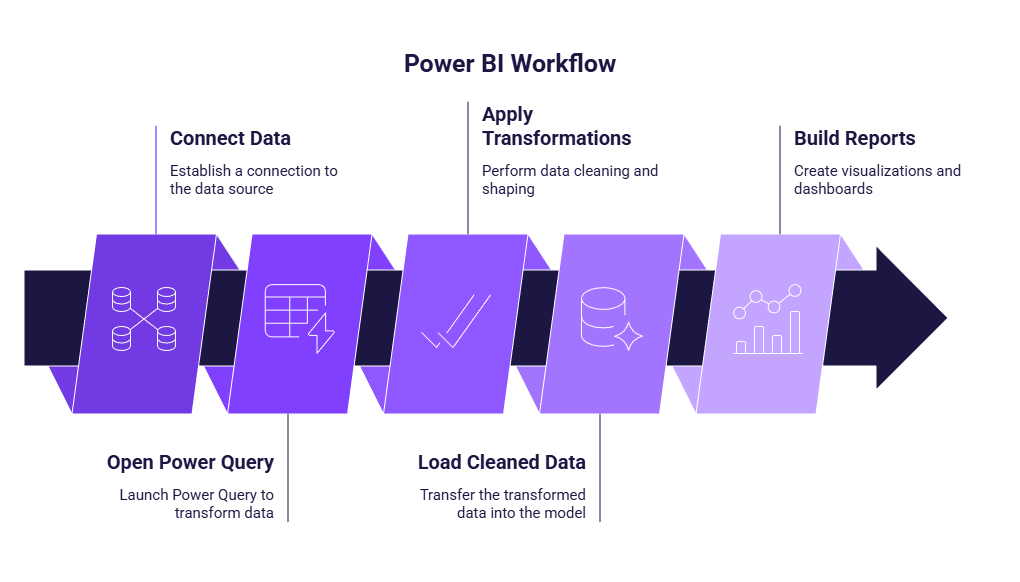
Where Power Query fits in the Power BI workflow
Power Query sits between data connection and reporting. A typical workflow looks like this:
- Connect data
- Open Power Query (Transform data)
- Apply transformations
- Load cleaned data into the model
- Build reports and dashboards
How Power Query works: key concepts
Queries vs steps: the core mental model
In Power Query, each dataset is represented by a query. A query usually becomes a table in your data model. Inside each query, Power Query records every transformation as an applied step. These steps are executed in order, from top to bottom.
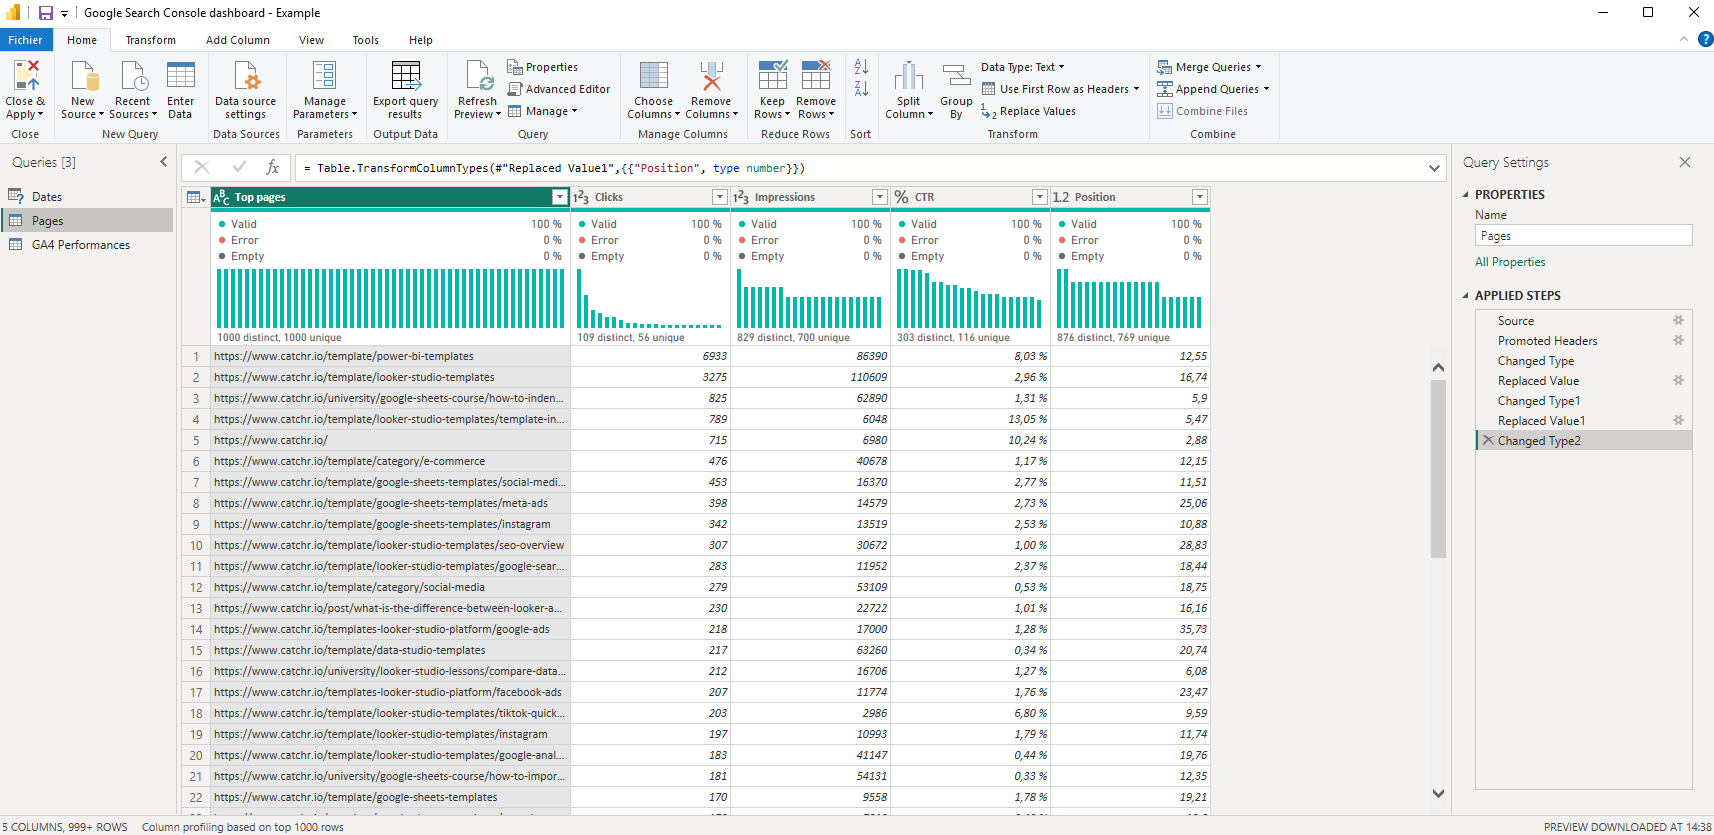
The key idea is this: Power Query is not about manually editing data. It’s about defining a sequence of instructions that Power BI can replay every time new data arrives. This makes reporting reproducible and reliable.
Applied steps best practices
A few good habits make Power Query much easier to maintain:
- Apply transformations one step at a time
- Keep steps readable and intentional
- Rename queries so their purpose is clear
- Avoid overcomplicating logic early
Parameters: reusable values you can change later
Parameters are optional and more advanced, but it’s useful to know what they are.
A parameter is a reusable value that can be changed without rewriting transformation steps. Common marketing examples include:
- a folder path
- a date range
- a market or region
You don’t need parameters to get started with Power Query, but they become useful as reports grow and need to be reused or adapted.
Conclusion
Power Query is the foundation of reliable Power BI reporting. It’s where raw marketing data is transformed into clean, consistent datasets that dashboards can trust. Understanding the basic concepts — queries, steps, and where Power Query fits in the workflow — is enough to start using it with confidence. Once this foundation is clear, preparing and combining marketing data in Power BI becomes much easier.

.svg)