Power BI semantic model explained
Understand the Power BI semantic model and learn how datasets, tables, relationships, and measures create consistent marketing KPIs and dashboards.
Power BI is often perceived as a dashboarding or visualization tool. But behind every chart, table, or KPI, there is something far more important: a semantic model. Understanding this concept is a turning point for marketers, because it changes how you think about reporting, consistency, and trust in your numbers.
In this article, we’ll explain what a semantic model is in Power BI, why it matters for marketing teams, and how datasets, tables, relationships, and measures work together to give meaning to your data.
What is a semantic model in Power BI?
A semantic model in one sentence
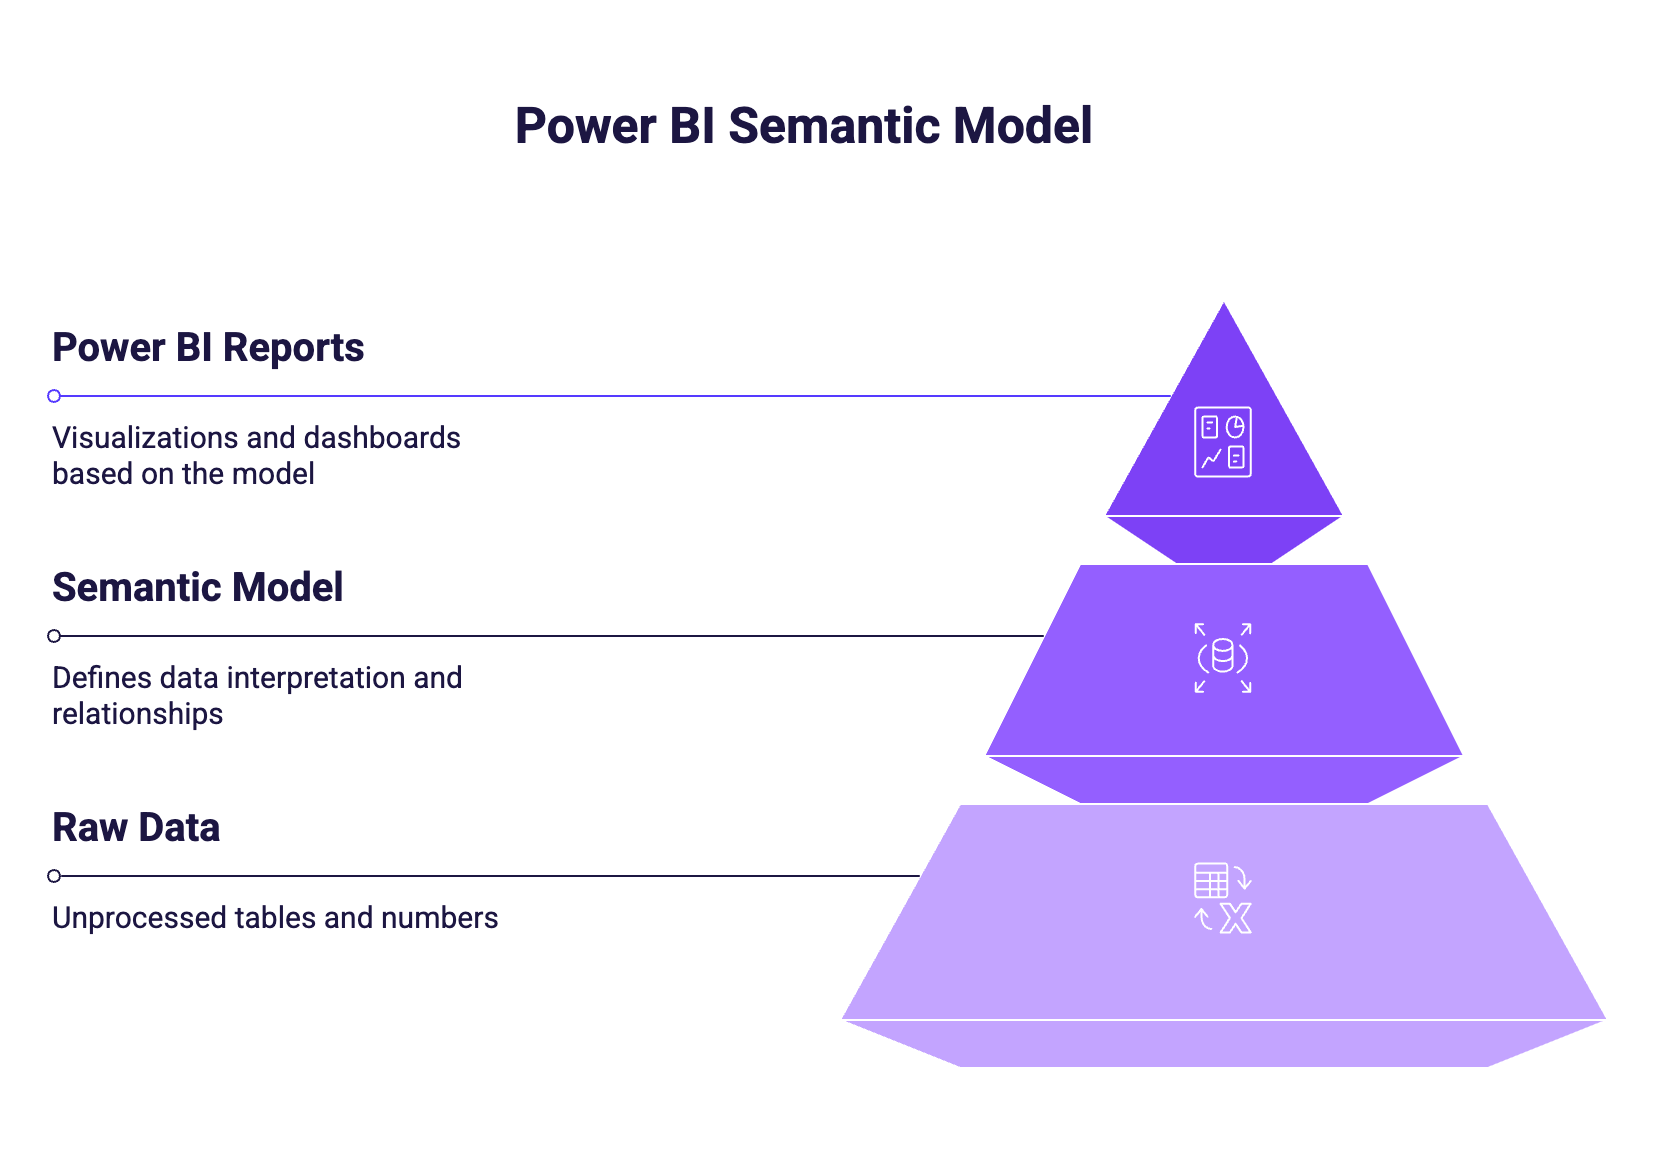
A semantic model defines how data should be interpreted, related, and calculated in Power BI.
It’s the layer that sits between raw data and reports. Instead of working directly with tables and numbers, Power BI uses the semantic model to understand what those numbers represent and how they should behave in different contexts.
Why Power BI calls it “semantic”
The word semantic refers to meaning. In Power BI, the semantic model is where meaning is defined:
- What a “conversion” actually is
- How revenue should be calculated
- How different datasets relate to each other
Once this meaning is defined, it can be reused consistently across all dashboards and reports.
Advantages of using a semantic model in Power BI
The building blocks of a Power BI semantic model
Datasets: the foundation
In Power BI, the dataset is the container that holds everything needed for reporting. It includes tables, relationships, and measures, and it feeds one or many reports.
From a marketing perspective, the dataset is the source of truth that all dashboards rely on.

All your datasets are stored in your Power BI Services workspaces.
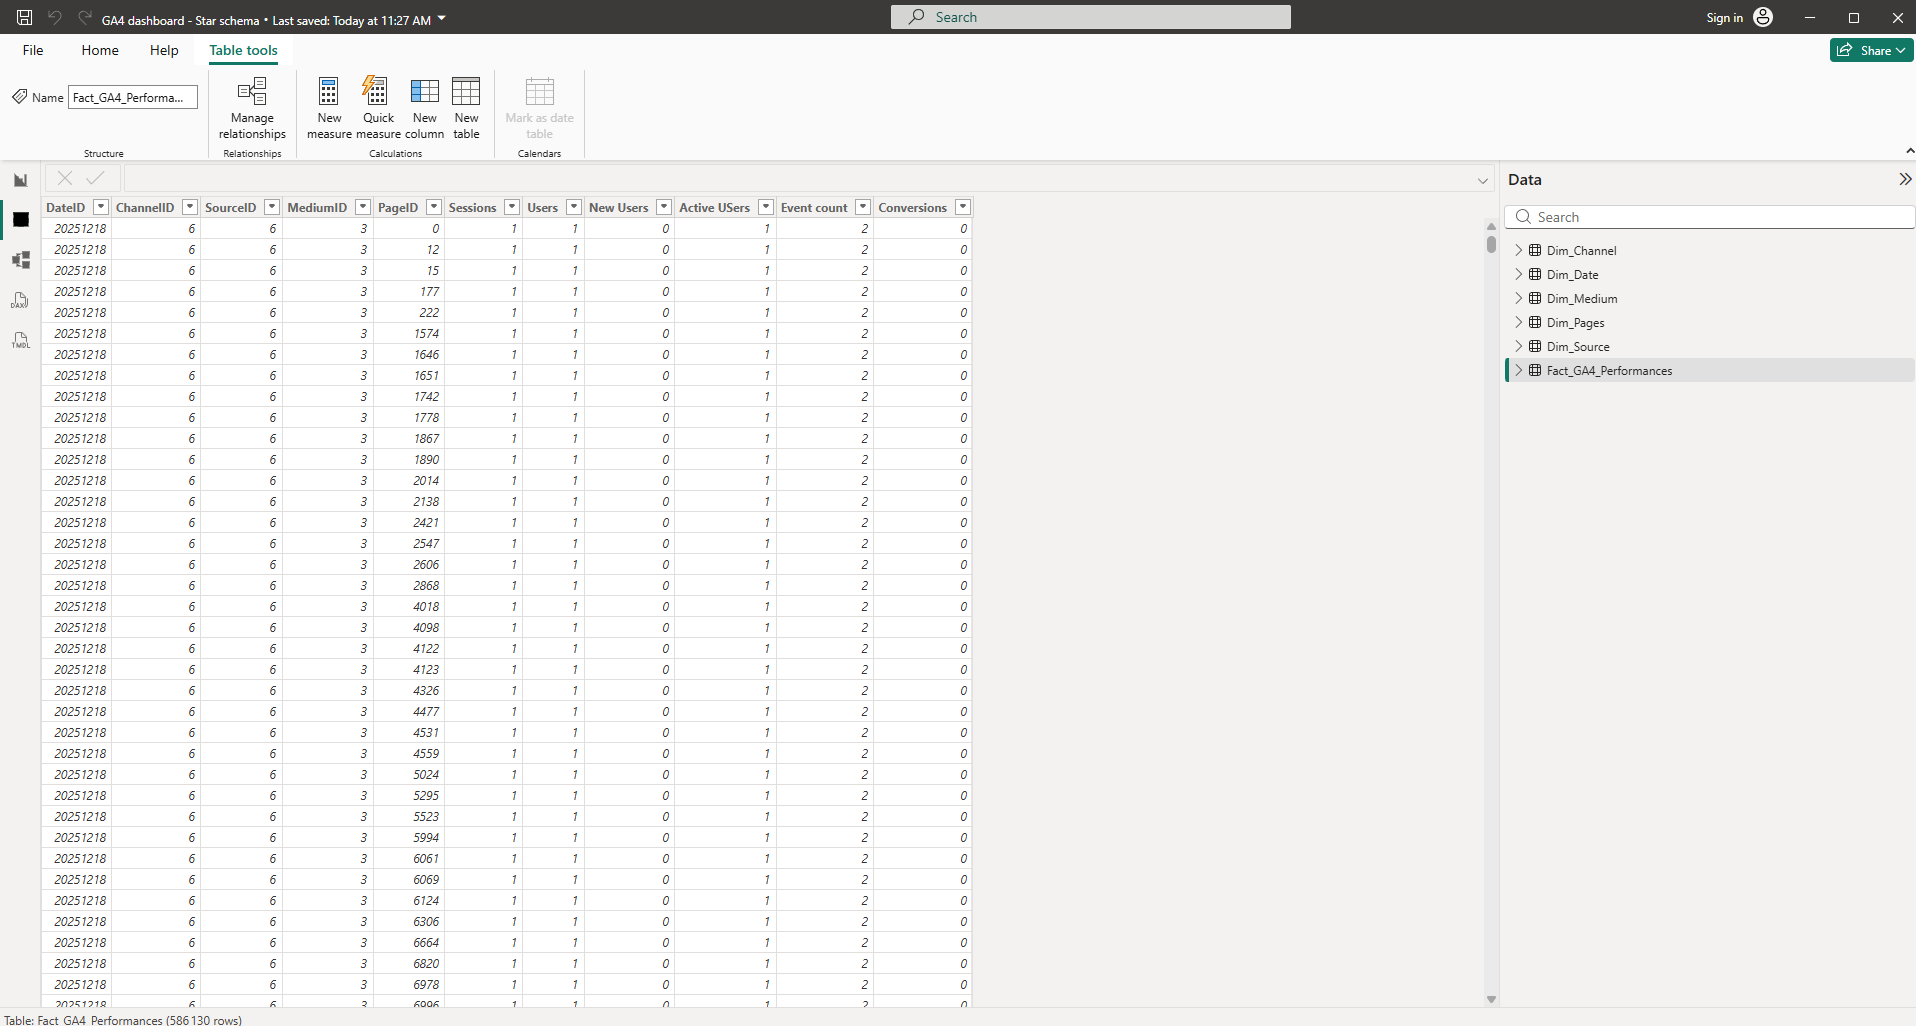
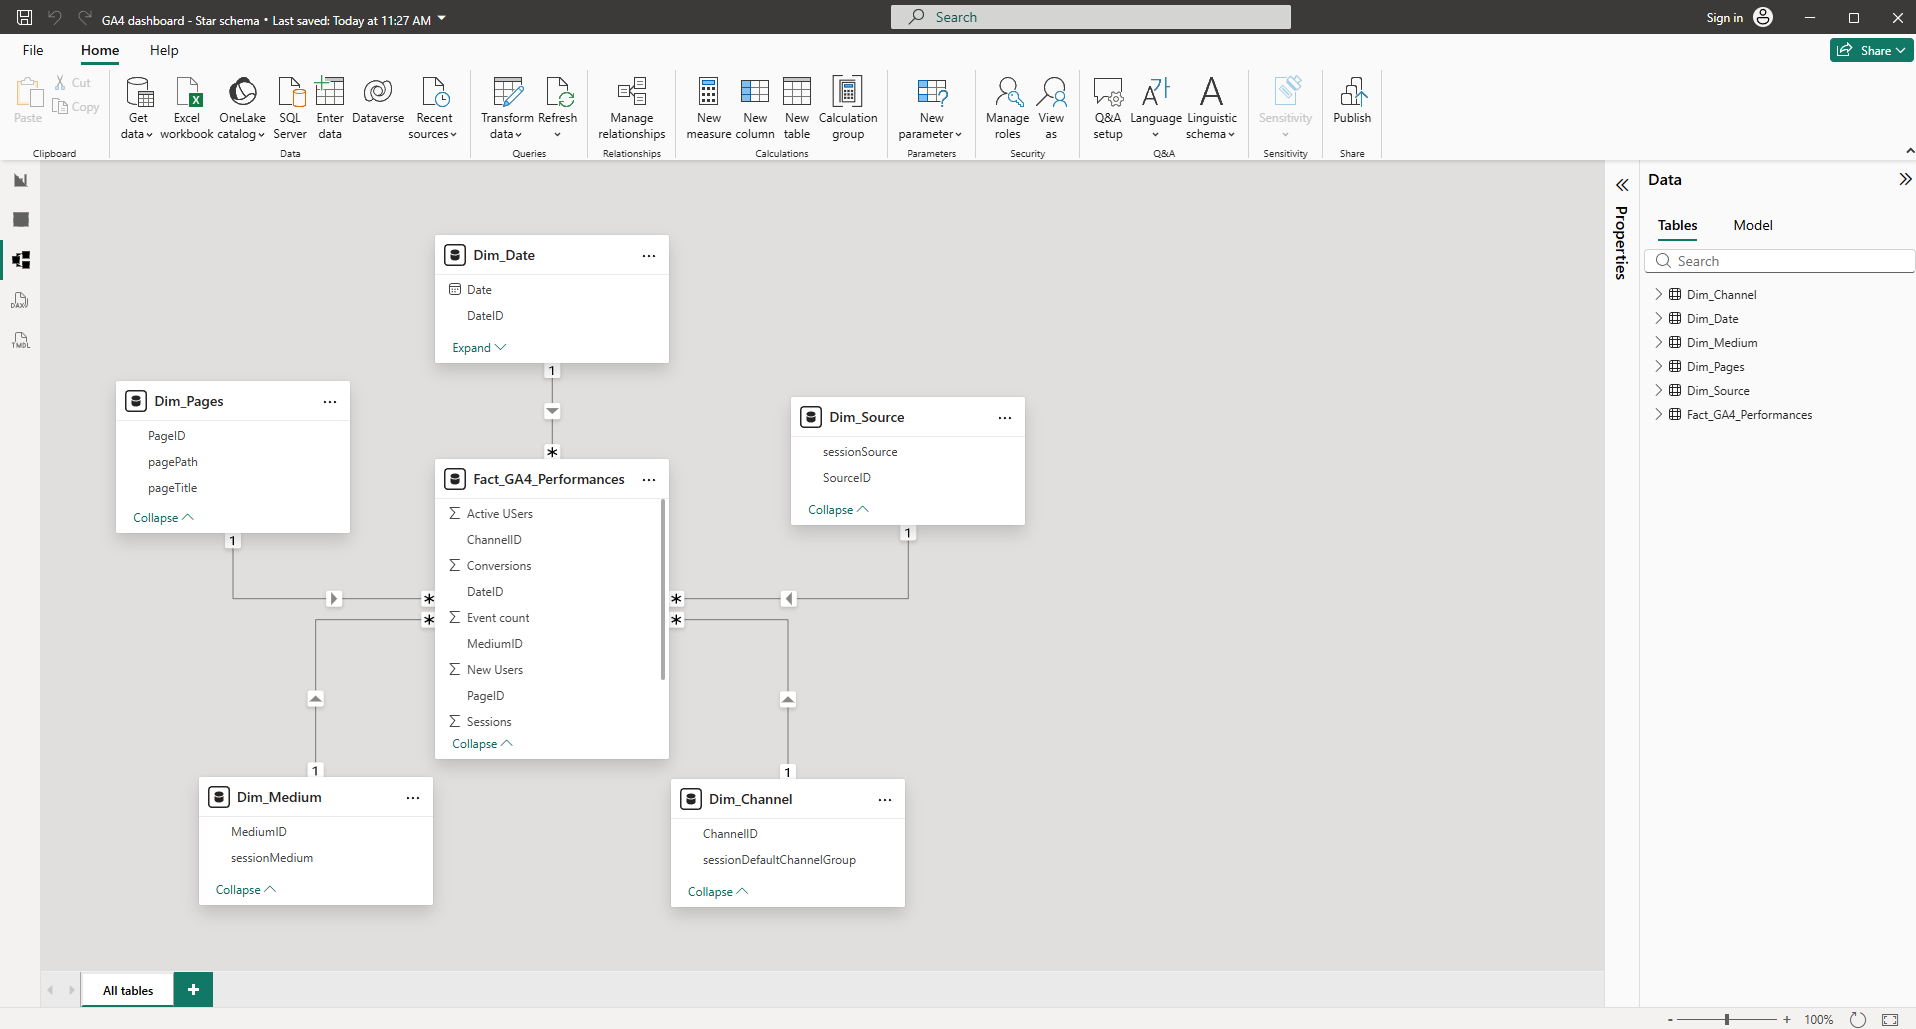
Tables: facts and context
Tables usually fall into two broad categories:
- Fact tables, which contain measurable data such as sessions, clicks, cost, conversions, or revenue
- Dimension tables, which provide context such as dates, campaigns, channels, countries, or devices
Fact tables answer what happened. Dimension tables explain where, when, and how it happened.
Relationships: how tables connect
Relationships define how tables are linked together. They tell Power BI how to combine data correctly when you build visuals.
For example:
- A campaign ID connects ad performance to campaign metadata
- A date field connects performance data to a date table
When relationships are incorrect or missing, numbers can be wrong even if the visuals look correct.
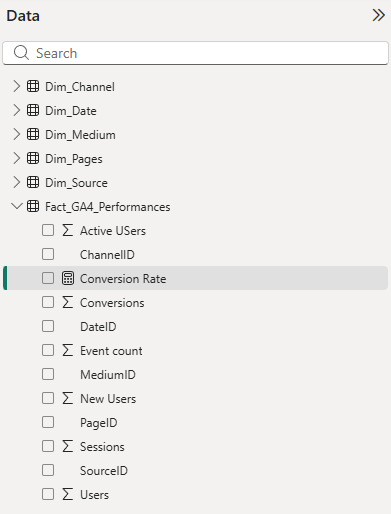
Measures: where KPIs really live
Measures are calculations defined in the semantic model. They are not stored values, but formulas that are evaluated dynamically based on filters and context.
This is where KPIs truly belong:
- conversions
- conversion rate
- ROAS
- average order value
What the semantic model is not
It’s important to clarify a few common misconceptions.
The semantic model is:
- not a visual
- not Excel-style cell logic
- not something defined per chart
Instead, it’s a shared layer that sits underneath all reports and defines how data should be interpreted everywhere.
Conclusion
Power BI is not just a visualization tool. It is a semantic modeling platform that gives meaning to data before it is displayed. For marketers, understanding the semantic model is key to building consistent KPIs, scalable dashboards, and trusted reports.
Once this concept is clear, everything else in Power BI, from DAX to advanced dashboards, becomes easier to understand and use effectively.
.svg)