Understanding Looker Studio fields
Understand the role of fields in Looker Studio, their types and aggregation methods, and discover best practices to manage and use them efficiently in your reports.
Prerequisites
To be able to work on the fields of a report, the following points must be observed:
- Have edit access to the report and data source(s)
- Have the correct rights and authentication mode (Owner/Viewer) set up to avoid surprises when editing.
- Have knowledge of the concept of data aggregation
About fields in Looker Studio
Fields represent all the data available for a data source. Each field has a type (metric or dimension), a format (date, URL, text, number, etc.), and an aggregation method in the case of a metric. A field inherits its type, format, and default aggregation from the source, but can be overridden at the report/graph level. There are three different ways to override this information.
Data source
This is the place to standardize: correct types, set default aggregations, define the currency, and create shared calculated fields (e.g., CPC, ROAS, Source/Medium). Everything you would do in each report should live here.
Report
Ideal for contextual adjustments: rename "Cost" to "Cost (EUR)", group campaigns for this report only, choose a specific display format. You keep the source clean while customizing the experience.
Chart
Perfect for quick testing and iteration: a temporary CASE, a format variant, a TO_TEXT() to display an ID. Document these deviations if you keep them: they are not reusable elsewhere.
Simple decision rules

Keep in mind the impact of rights: depending on Owner/Viewer, a user may or may not be able to see certain fields, and above all, may not be able to edit them. Reusable sources limit duplication and discrepancies.
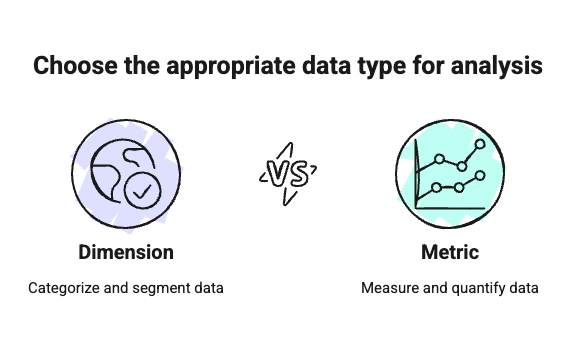
What are the differences between a metric and a dimension?
Dimensions
Definition: these are qualitative, descriptive attributes that allow data to be categorized or segmented. They generally appear in the form of text, dates, or categorical values.
Role: they serve as "keys" for organizing data. They are generally used as rows or columns in a table, or as labels in a graph.
Examples:
- Date
- Country
- Traffic source (Google, Facebook, Email, etc.)
- Campaign name
- Device type (mobile, desktop)
- Age group
Metrics
Definition: these are quantitative, measurable data that can be aggregated (sum, average, rate, etc.). They appear in the form of numbers.
Role: they represent the value being analyzed. They are often used as numerical values in graphs or tables.
Examples:
- Number of clicks
- Impressions
- Conversion rate
- Cost
- Revenue
The interaction between the two types
A dimension segments the information that a metric will deliver. For example, if you want to display clicks by country, the dimension is "Country" and the metric is "Clicks." This interaction transforms raw data into actionable information. It is this dynamic combination of dimensions and metrics that enables flexible and customized performance visualization. In Looker Studio, metrics and dimensions interact with each other in almost all available visualizations.
Different types of formats
Type inference from the connector
The connector sends Looker Studio a schema where each field has a default type. Looker Studio relies primarily on this schema to type the fields in the report.
- Numeric: number, percent, duration
- Text: label, id, campaign name, etc.
- Date and time: date, year, month, week, hour, etc.
- Boolean: true, false
- Geo: country, city, continent, zip code, address, latitude, longitude
- Currency: EUR, USD, GBP, INR, etc.
- URL: URL or image
The list of different field types available: https://developers.google.com/looker-studio/connector/reference#semantictype
1. Time-related formats
In marketing, the concept of time is central. You will often want to analyze your performance by year, month, week, or even hour.
- Year: to track your key indicators on an annual basis.
- Year + quarter: useful for financial analysis or large seasonal campaigns.
- Year + month: ideal for tracking the monthly evolution of your KPIs.
- Year + week: useful for digital marketing, where campaigns are often planned on a weekly basis.
- Specific day: allows you to see the impact of a one-off event such as a campaign launch.
- Day of the week: essential for understanding which day your actions perform best.
- Time: provides an hourly overview, useful for example for sending emails or advertising.
- Duration (in seconds): corresponds to a measure of elapsed time, such as the average session duration on a website.
2. Geographic formats
These formats allow you to view your data according to the location of your audiences or customers.
- Countries and country codes: useful for comparing performance between different international markets.
- Continents and sub-continents: provide a macro view for global strategies.
- Regions and regional codes: allow you to drill down to the state or province level.
- Cities and city codes: relevant for local marketing.
- Latitude and longitude: useful for placing data on a precise map.
3. Numeric formats
These form the basis of your performance indicators.
- Number: used for all raw metrics such as impressions, clicks, or leads.
- Percentage: essential for rates (CTR, conversion rate, open rate).
- Duration: useful for measuring time spent or the duration of an action.
- Currency: useful if you want to highlight monetary data such as the cost of a campaign.
4. Text and logical formats
These are used to describe, categorize, or create filters.
- Text: used to name campaigns, identify traffic sources, or display labels.
- Boolean value (true/false): useful for creating simple filters (e.g., mobile traffic or not).
- URL: allows you to integrate clickable links into your reports.
- Image: allows you to view the image from a link.
Different types of aggregation
Aggregation determines how Looker Studio combines multiple rows when you place a field in a chart or table.
There are several types of aggregation that can be classified into three distinct categories.
1. Numeric aggregations
These functions apply to fields containing numerical values. They are used to calculate statistical indicators.
- SUM: calculates the total sum.
- AVG: calculates the average.
- MAX: returns the highest value.
- MIN: returns the lowest value.
2. Counts
These functions apply to any type of field (text, number, ID, etc.) to count occurrences.
- COUNT: counts the total number of entries, including duplicates.
- COUNT_DISTINCT: counts only unique entries.
3. Special modes
These options control how Looker Studio behaves on fields when no particular aggregation is desired or when the tool must decide automatically.
- NONE: no aggregation is applied, the data is left raw.
- AUTO: Looker Studio automatically chooses the appropriate aggregation, especially in calculated fields.
Conclusion
Mastering fields in Looker Studio is essential for building reliable, readable, and actionable reports. Understanding the difference between dimensions and metrics, knowing where to edit a field (source, report, or graph), and applying the right formats or aggregations not only helps you avoid misinterpretations but also saves valuable time during analysis.
By adopting a clear logic—standardize in sources, contextualize in reports, and experiment in graphs—you create a solid foundation for your visualizations. This ensures consistency in your data, limits duplicates, and promotes smooth collaboration between different users.
With good field management, Looker Studio becomes a powerful tool for transforming raw data into concrete marketing insights, and Catchr further simplifies this step by automating the preparation and formatting of your data, without any technical effort.
