Understanding calculated fields in Data Studio
Learn how to use calculated fields in Data Studio (formerly Looker Studio), what are they, how and when to use them. Complete guide from beginner to expert level.
When using Data Studio (formerly Looker Studio), you will quickly need/want to add fields that are not natively available in your data source. You will then probably need to use calculated fields. In this lesson, we will define them, explain what they are used for, and how to use them. We will also show you some examples of commonly used calculated fields.
What is a calculated field in Data Studio?
A calculated field is a metric or dimension that you create directly in Data Studio from data source, without modifying the original database. This allows you to apply formulas, conditions, or transformations to enrich your analyses and visualizations. For example, you can create a calculated field to obtain the conversion rate by dividing conversions by clicks.
Where can you create a calculated field in Data Studio?
In Data Studio, there are two levels for creating a calculated field.
In practice:
- For standard, reusable KPIs, use the source level.
- For temporary calculations or calculations related to a single graph, use the graph level.

At the data source level
- Open your Data Studio report
- Click Resource → Manage Added Data Sources
- Select the relevant data source
- Click Add Field
Fields calculated at the data source level are created in the data source. Their strength lies in their reusability. Available in all reports using this source, they ensure consistency of metrics and can be integrated into filters, controls, or other calculated fields. However, they do not work with merged data and require editing rights on the source.
A common example: a conversion rate that is useful at the company level but unusable with blended data source (e.g., Google Analytics + CRM).
At the chart level
- Click on the relevant graph (e.g., table, time series, diagram).
- Then click Add metric, Add dimension, or directly on the field used in your chart
- Click Add calculated field

Calculated fields at the graph level prioritize flexibility. Created directly in a graph (table, bar chart), they allow for quick testing without modifying the source.
Compatible with data source blends, they are ideal for one-off reports. However, their scope is limited to the original chart, and they cannot reference other calculated fields specific to the chart.
To use them, you need editing rights for the report. A common use case is analyzing the impact of a campaign by combining sales data and marketing indicators via a temporary calculation such as ROI.
Basics of Data Studio Calculated Field
Imagine you are looking at your marketing data, rows and rows of numbers. With a calculated field, you can breathe life into them, like adding a spark of imagination to transform numbers into real stories.
Example Without a Function
Take two values: Revenue and Cost.
Alone, they’re just numbers. But if you create a calculated field like this:
Revenue - Cost you get Profit, a clear metric that shows how much you earn after expenses.
Example With a Function
Now, suppose you want to classify your campaigns instead of just measuring them. You can use a rule in a calculated field:
IF(CTR > 0.05, "High Performing", "Needs Improvement")
This formula helps you quickly see which campaigns perform well and which ones need optimization.
Aggregation Functions
Data Studio also provides basic aggregation functions that are often used inside calculated fields:
- SUM: adds all the values in a field, for example
SUM(Cost)to calculate total spend. - AVG: calculates the average value, such as
AVG(CTR)to find the mean click-through rate. - MAX: returns the highest value, for instance the best-performing revenue day with
MAX(Revenue). - MIN: returns the lowest value, such as the cheapest cost-per-click using
MIN(CPC). - COUNT: counts the total number of rows or records, for example
COUNT(Page)to know the number of pages tracked. - COUNT_DISTINCT: counts unique values only, such as
COUNT_DISTINCT(Campaign)to see how many campaigns are active.
Essential calculated fields in Data Studio
Data Studio offers a comprehensive list of functions that can be used in calculated fields, including seven main types of functions:
- arithmetic
- conditional
- text
- date
- aggregation
- geography
- miscellaneous
Here we will discuss the essential functions that are frequently used in Data Studio.
Mastering text manipulation functions
Raw text data often needs to be cleaned up before it can be used. Manipulation functions transform complex information into readable data for targeted reports.
For example, the CONCAT function combines multiple fields into one. To obtain a source/medium, CONCAT(Source, " / ", Medium) creates a unified dimension from two separate sources. This allows you to structure marketing campaigns by cross-referencing source and channel data.
Another example, REGEXP_EXTRACT extracts specific character strings from long strings.
It is ideal for isolating UTM parameters in URLs. The formula REGEXP_EXTRACT( URL, '^https://[^/]+/([^/]+)/' ) retrieves the first part of a URL path.
To extract a UTM_SOURCE code, use REGEXP_EXTRACT( URL, 'utm_source=([^&]+)'), transforming links into usable segments.
Grouping into channels with CASE
In your marketing data, campaigns and traffic sources are often scattered and inconsistent: Facebook Ads may appear in different formats (Facebook, fb, meta, etc.), and your email campaigns are sometimes mixed with other sources.
With the CASE statement in Data Studio, you can group your traffic sources into clear and consistent channels.
For example:
CASE
WHEN CONTAINS_TEXT(Source,"facebook")
	OR CONTAINS_TEXT(Source,"fb")
    OR CONTAINS_TEXT(Source,"meta")
    THEN "Paid Social"
WHEN CONTAINS_TEXT(Source,"google") CONTAINS "google"
	THEN "Paid Search"
WHEN CONTAINS_TEXT(Source,"newsletter") CONTAINS "newsletter"
	THEN "Email"
ELSE "Other"
END
Result: instead of confusing reports with 50 different source variants, you get a consolidated view by channel: SEO, SEA, Social, Email, Referral, etc.
Working with dates and durations
Time data becomes clearer thanks to date functions. They transform timestamps into measurable durations, which are crucial for performance analysis.
DATETIME_DIFF calculates the difference between two dates. Let's say you want to calculate the difference between the order date and the shipping date for the Shopify connector. You can do a DATETIME_DIFF(OrderDate, ShippingDate, DAY).
When your dates are in text format, PARSE_DATETIME converts them into usable fields.
This function opens up analysis to poorly structured historical data.
For example, PARSE_DATETIME('%d/%m/%Y', signupDate) converts "01/12/2023" into a date type that can be formatted by Data Studio.
This allows you to link old time series to current data for comparison.
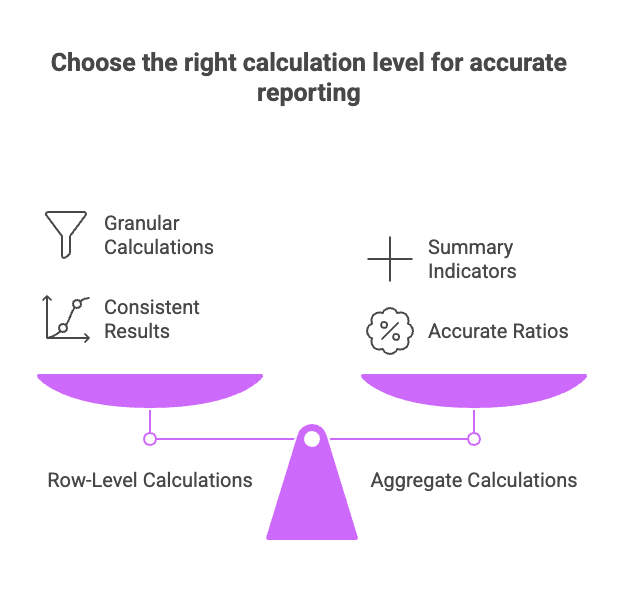
Understanding the aggregation of calculated fields
Do you know why some ratios sometimes display inconsistent results? The answer lies in understanding aggregation levels.
In summary, row-level calculations are ideal for detailed metrics, while aggregate formulas are necessary for summary indicators. Understanding this distinction will help you avoid most data logic errors in your reports.
Calculations before aggregation (row by row)
Fields calculated at the row level process each record individually before any summarization. For example, the formula Price * Quantity Sold generates a new subtotal column for each row.
Data Studio then applies a default aggregation (usually SUM) to these intermediate values. This approach ensures consistent results when aggregating later in charts or tables.

Calculations after aggregation (on aggregated metrics)
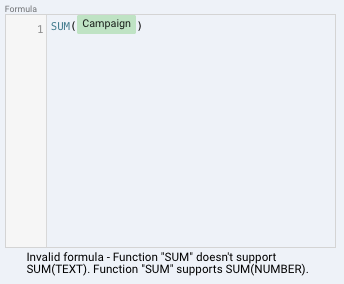
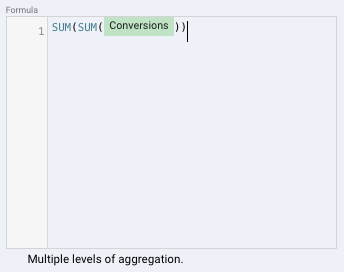
Formulas such as SUM(Profit)/SUM(Revenue) illustrate a calculation on already aggregated data. Here, each component is first consolidated, then the ratio is applied.
The result is an Auto aggregation that cannot be modified. Caution: mixing aggregated and non-aggregated fields causes frequent errors. For example, Google Ads CTR (click-through rate) is a pre-aggregated metric. A filter based on CONCAT(Campaign, " : ", Click Type) generates an error because the raw data is unavailable.
Troubleshooting: solutions to the most common errors
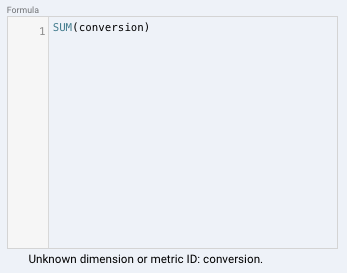
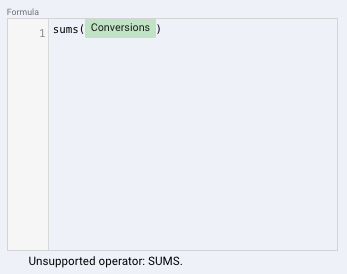
Problem: "The formula is invalid" or "Unknown dimension or metric ID"
- Syntax errors are common. A missing parenthesis, a forgotten comma, or a misspelled function will block creation. Check the field names: they must match those in the source exactly.
- Permissions also play a role. Without editor rights on the data source, it is impossible to create calculated fields. The same applies to charts: editing a report requires sufficient access rights.
- Visual indicators such as grayed-out fields signal incompatibilities. For example, a filter based on a calculated field may prevent aggregated metrics from being displayed.
Problem: "Data type error"
- This error occurs when mathematical operations are attempted on text fields. Example: adding "Price" (number) and "Product ID" (text). The solution? Use
CAST(TextField AS NUMBER)to convert the text to a number. - Also note that ratio metrics (such as CTR) are often already aggregated by the source. Any attempt to re-aggregate them will trigger an error. In this case, use raw data from Google Sheets or BigQuery for greater flexibility.
Problem: "Unable to combine aggregated and non-aggregated metrics"
This error occurs when you mix a non-aggregated field (e.g., Price) with an aggregated field (e.g., SUM(Sales)). Simple rule: either all fields are aggregated, or none are.
Our best practices for using calculated fields
Prioritize clarity: break down complex formulas
Complex formulas are difficult to read and generate frequent errors. Create several simple fields for each calculation step.
Example: Break down a Total calculation into Subtotal and Discount. This approach makes it easier to reuse elements in other reports.
Be explicit: name and document your fields
A name like Conversion Rate (Objective 1) is better than CR. This avoids misunderstandings, especially when working in a team.
Use the field description to clarify the logic used. For example, note why a discount threshold applies from $500 and not $450. This speeds up the work of your colleagues or successors, especially in the event of a subsequent update.
Always validate: test your calculations
An untested calculated field can skew your reports. Display it in a table next to the source data and manually check a few results.
Example: If you create a Margin field using (Revenue - Cost)/Revenue, compare the first 5 rows with manual calculations. This ensures that mathematical operators and data types (number, text) are correctly aligned.
Calculated fields at a glance
Data Studio's (formerly Looker Studio) calculated fields transform raw data into custom indicators tailored to your needs. Created either at the data source for reuse or directly in charts for greater flexibility, they allow you to manage segmentation, perform advanced calculations, and enrich your analyses. By structuring your formulas correctly and avoiding common errors, you improve the reliability and accuracy of your reports. Mastering these fields means gaining more relevant insights and driving your business in a truly data-driven way.

