Custom bins in Looker Studio
Learn how to create bins in Looker Studio to group your data by value ranges, simplify analysis, and uncover trends in your reports.
Do your Looker Studio charts look like a mess of numbers? Looker Studio binning transforms raw data into clear categories, making trend analysis much easier. Discover how to create custom ranges (for example, age groups or income brackets) without complex formulas, using Looker Studio’s native feature.
What is binning in Looker Studio and why use it?
Have you ever tried to analyze a histogram filled with hundreds of bars representing prices or durations? The result is often an unreadable chart. Looker Studio binning solves this problem by grouping numerical data into custom intervals, turning a cluttered dataset into a clear and meaningful visualization.
Binning, or interval segmentation, involves dividing continuous values (such as ages, amounts, or durations) into logical groups. Looker Studio lets you do this easily, without using complex formulas like CASE WHEN or SQL queries, thanks to its simple and intuitive interface.
The advantages are numerous. First, it simplifies visualization: instead of overwhelming the viewer with too much detail, you highlight key trends. For example, a sales histogram by price range (e.g., €0–50, €50–100) clearly shows the most important categories.
Second, it makes interpretation easier by revealing patterns, such as a concentration of sales within a specific price range.
Finally, it allows you to adjust granularity to your needs: use wider intervals for an overview or narrower ones for detailed analysis, such as specific duration ranges in SEO performance studies.

Prerequisites
To create and configure bins in Looker Studio, you must:
- Have edit access to the data source.
- Identify one or more numeric fields (metrics) to segment (for example: age, income, average basket value).
Creating Bins in Looker Studio
There are two ways to create bins in Looker Studio:
- At the data source level
- At the visualization level
Create a Bin at the data source level
Bins created at the data source level become reusable dimensions across all reports connected to that source. This ensures cross-report consistency, which is especially useful for standardized segmentations such as age ranges (e.g., 18–25, 26–35) or income brackets (e.g., 0–50k, 50k–100k).
Creating bins at the data source level helps avoid redundancy and simplifies maintenance, particularly for recurring analyses.
To create a bin at this level:
- Edit the data source: Resources > Manage added data sources > Edit
- Click Add a field > Add bin
Create a chart-specific Bin
Chart-specific bins remain isolated from the rest of the data source. This allows you to adjust a visualization locally without affecting shared rules. For example, you can test a segmentation (such as 0–500€ / 500–1000€) without impacting other reports.
They are ideal for one-time analyses or experiments where flexibility is key. If you duplicate the chart, the bin is copied along with it but remains editable in the new version, preserving the integrity of the global data source.
To create one:
- Add or select a visualization.
- Click to add or edit a dimension.
- Then click Add bin instead of selecting an existing dimension.
Comparison Table: Which method should you choose?
Configure Binning in Looker Studio
The process of configuring a “Bin” field
Once you have chosen where to create your bin, it’s time to configure it:
- Name your bin with a clear and unique title, avoiding reserved keywords such as “Sum” or “Average”.
- Select the field you want to work on.
- Choose the desired format (Interval, Integer, or Relational).
- Select the bin type (equal-sized or custom-sized).
- Define your ranges: size, minimum, and maximum values.
Choosing the right Bin format
Looker Studio offers three display formats for bin labels:
- Interval [x, y): includes x but excludes y. Example: [0,10) groups values from 0 to 9.99. Ideal for continuous data such as engagement durations.
- Integer x to y: for discrete integer values. Example: “20 to 29” for age, useful for defining an ad audience.
- Relational ≥x and <y: for continuous numerical values. Example: “≥1000 and <2000” for amounts in euros, useful for analyzing income ranges.
Enable the option “Bin remaining values outside the min. and max. as separate bins” to capture outlier data.
For example, if you segment sales into “0–500€” and “500–2000€”, this checkbox will automatically create a third group “2000€+” for large orders. This prevents you from losing crucial information, such as outliers that may indicate potential opportunities or risks.
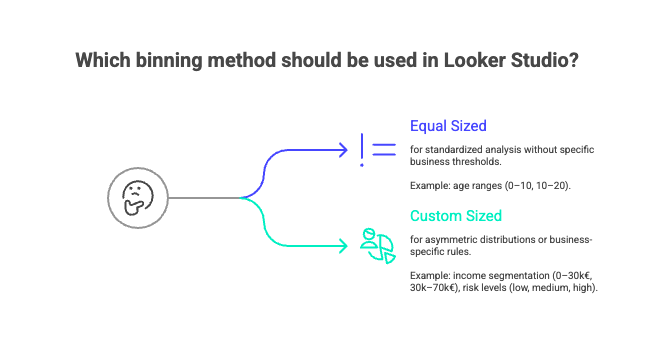
Choosing the right type of Bin
Equal-sized
The Equal-sized type divides data into equal intervals.
For example, 10-unit ranges such as 0–10, 10–20 to analyze the distribution of ages or standardized scores.
To configure it, specify the bin size (e.g., 10), the minimum value (e.g., 0), and the maximum value (e.g., 100).
This format is best suited for uniform distributions, such as age group analysis (0–10, 10–20) or satisfaction scores (1–2, 2–3).
Custom-sized
The Custom-sized type allows variable intervals, useful for business thresholds.
For example, segment income into 0–30k€, 30k–70k€, 70k€+ for marketing analysis, or sales into 0–500€, 500–2000€, 2000€+ for financial reporting.
You define the breakpoints in ascending order, separated by commas (e.g., 0,30000,70000).
This option is ideal for asymmetric distributions or business-specific rules, such as bonus tiers or VIP customer groups.
Binning vs Grouping
Binning and Grouping are two distinct tools in Looker Studio. Binning segments numerical data into intervals, while grouping combines categorical values. Understanding both is key to structuring your data effectively.
Binning applies to quantitative data such as ages, durations, or amounts.
For example, session durations can become “0–30s”, “31s–2min”, “2min+.”
You can use fixed-size bins (e.g., groups of 10) or custom bins (e.g., income ranges: 0–20k, 20k–50k, 50k+) to adjust the level of granularity to your analysis.
Grouping, on the other hand, applies to qualitative data such as countries or traffic sources.
For example, you can group “google,” “bing,” and “qwant” under “Search Engines.”
Similarly, you can simplify product names (“Ergonomic Chair” + “Office Chair” → “Seating”), reducing visual complexity in your reports.
Binning segments a continuous scale, like a ruler with intervals, while grouping collects distinct elements into labeled boxes. One organizes; the other classifies.
In summary, binning discretizes numerical data into intervals for a clearer visual analysis, while grouping organizes categories. Their use depends on the nature of your data and your analytical goals. For example, in marketing, binning reveals conversion thresholds by budget range, while grouping compares channel performance (social networks, email, etc.). Combining both enhances the readability and strategic value of your reports.
Limitations and Alternatives to Looker Studio’s native Binning
When simple Binning is not enough
Looker Studio’s binning feature is effective for segmenting numerical data into regular or custom intervals, but it reaches its limits with more complex logic.
For instance, if your segmentation depends on multiple conditions (e.g., grouping sales by both revenue threshold and number of items sold), native binning cannot handle such nested rules.
Likewise, non-sequential intervals (e.g., 0–10, 15–25, 30–40) require alternative approaches.
Alternatives for more flexibility
To work around these limitations, several options are available:
1. Calculated Fields with CASE WHEN
For advanced logic, use SQL-style formulas such as CASE WHEN. Example:
CASE
 WHEN Age <= 5 THEN FLOOR(Age/1)*1
 WHEN Age <= 20 THEN FLOOR(Age/5)*5
 ELSE FLOOR(Age/10)*10
END
This approach offers flexibility but requires manual coding.
Looker Studio Pro users can use Gemini to generate such formulas from natural language descriptions.
2. Data Preprocessing (e.g., BigQuery)
For advanced cases like spatial binning, it is often better to structure data upstream.
Optimizing Bin management and visualization
Creating bins at the data source level ensures consistency across all reports.
For example, a marketing team can define a “Customer Age” bin (18–25, 26–35) once and reuse it in every dashboard.
This approach prevents configuration errors and simplifies maintenance, especially for organizations managing multiple reports.
To reuse a bin, simply copy the original chart. The associated calculated fields are preserved, making it faster to create comparative dashboards without rebuilding rules.
Conclusion
Binning in Looker Studio segments raw data into clear ranges, revealing trends and performance thresholds. Combined with grouping and calculated fields, it strengthens both the readability and strategic impact of your dashboards.

